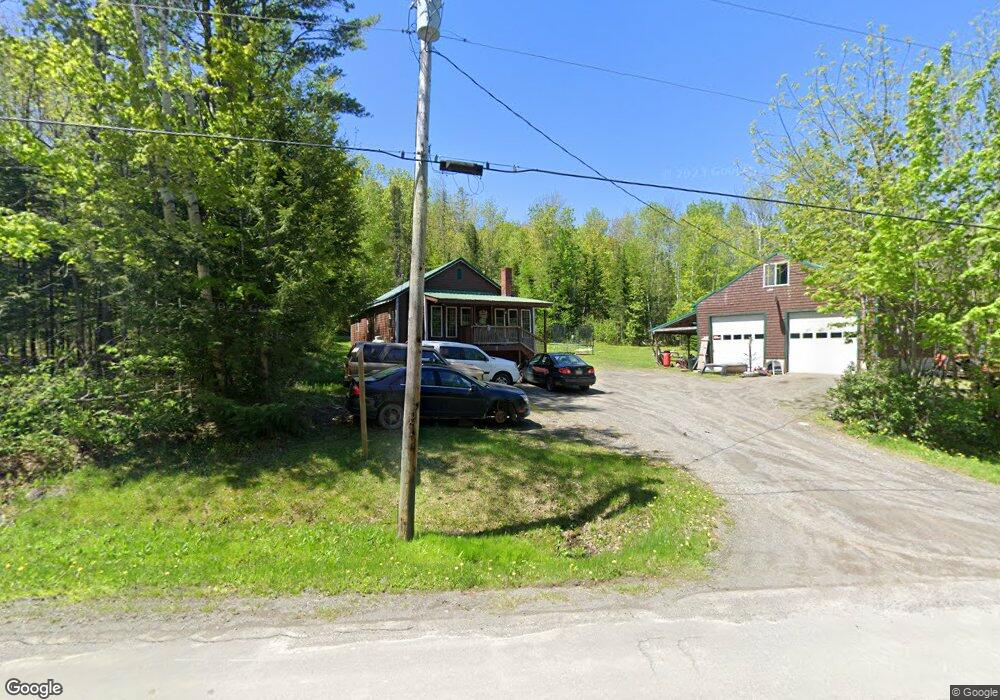
456 Steadmans Landing Rd Dover Foxcroft, ME 04426
Estimated Value: $213,000 - $293,000
3
Beds
1
Bath
1,008
Sq Ft
$250/Sq Ft
Est. Value
About This Home
This home is located at 456 Steadmans Landing Rd, Dover Foxcroft, ME 04426 and is currently estimated at $251,924, approximately $249 per square foot. 456 Steadmans Landing Rd is a home located in Piscataquis County with nearby schools including Se Do Mo Cha Elementary School and Se Do Mo Cha Middle School.
Ownership History
Date
Name
Owned For
Owner Type
Purchase Details
Closed on
Aug 8, 2018
Sold by
Giles 3Rd Charles E and Tibbetts Theresa M
Bought by
Giles Christopher
Current Estimated Value
Home Financials for this Owner
Home Financials are based on the most recent Mortgage that was taken out on this home.
Original Mortgage
$54,400
Outstanding Balance
$47,244
Interest Rate
4.5%
Mortgage Type
Unknown
Estimated Equity
$204,680
Purchase Details
Closed on
Jul 27, 2018
Sold by
Giles 3Rd Charles E and Tibbetts Theresa
Bought by
Levesque Michael N and Levesque Jeannette P
Home Financials for this Owner
Home Financials are based on the most recent Mortgage that was taken out on this home.
Original Mortgage
$54,400
Outstanding Balance
$47,244
Interest Rate
4.5%
Mortgage Type
Unknown
Estimated Equity
$204,680
Purchase Details
Closed on
Jun 20, 2013
Sold by
Giles 3Rd Cahrles E
Bought by
Giles 3Rd Cahrles E and Tibbetts Theresa M
Home Financials for this Owner
Home Financials are based on the most recent Mortgage that was taken out on this home.
Original Mortgage
$76,000
Interest Rate
3.45%
Mortgage Type
Commercial
Create a Home Valuation Report for This Property
The Home Valuation Report is an in-depth analysis detailing your home's value as well as a comparison with similar homes in the area
Home Values in the Area
Average Home Value in this Area
Purchase History
| Date | Buyer | Sale Price | Title Company |
|---|---|---|---|
| Giles Christopher | -- | -- | |
| Levesque Michael N | -- | -- | |
| Giles 3Rd Cahrles E | -- | -- |
Source: Public Records
Mortgage History
| Date | Status | Borrower | Loan Amount |
|---|---|---|---|
| Open | Giles Christopher | $54,400 | |
| Previous Owner | Giles 3Rd Cahrles E | $76,000 |
Source: Public Records
Tax History Compared to Growth
Tax History
| Year | Tax Paid | Tax Assessment Tax Assessment Total Assessment is a certain percentage of the fair market value that is determined by local assessors to be the total taxable value of land and additions on the property. | Land | Improvement |
|---|---|---|---|---|
| 2024 | $1,894 | $111,400 | $23,400 | $88,000 |
| 2023 | $1,710 | $92,200 | $21,600 | $70,600 |
| 2022 | $1,638 | $81,900 | $19,800 | $62,100 |
| 2021 | $1,754 | $81,600 | $18,000 | $63,600 |
| 2020 | $922 | $81,600 | $18,000 | $63,600 |
| 2019 | $1,754 | $81,600 | $18,000 | $63,600 |
| 2018 | $746 | $81,600 | $18,000 | $63,600 |
| 2017 | $1,705 | $81,600 | $18,000 | $63,600 |
| 2016 | $1,652 | $81,600 | $18,000 | $63,600 |
| 2015 | $1,518 | $81,600 | $18,000 | $63,600 |
| 2014 | $1,489 | $81,600 | $18,000 | $63,600 |
| 2013 | $1,440 | $81,600 | $18,000 | $63,600 |
Source: Public Records
Map
Nearby Homes
- 560 Steadmans Landing Rd
- M18 L13b Fox St
- 1 Weather Way
- 10 Phoebe Island Rd
- 45 Beaver Brook Rd
- M6L16-12-3 Beaver Brook Rd
- 17 Klimavicz Rd
- 12 Beach View Rd
- 962 Greeley Landing Rd
- 9 State Park Rd
- 38 State Park Rd
- Lot 5 Peterson Rd
- Lot #17A Greeley's Landing Rd
- 544 North Rd
- 11 Salmon Rd
- 139 Fern Rd
- 90 Holmes Rd
- M1/L1-3 Bowerbank Rd
- 153 Holmes Rd
- Lot9 Bear Brook Subdivision
- 448 Steadmans Landing Rd
- 470 Steadmans Landing Rd
- 418 Steadmans Landing Rd
- 515 Steadman's Landing Rd
- 515 Steadmans Landing Rd
- 394 Steadmans Landing Rd
- 526 Steadmans Landing Rd
- 523 ''Steadman''''s Landing Rd
- 0 Parson Landings Rd Unit 1517071
- 399 Steadmans Landing Rd
- 550 Steadmans Landing Rd
- TBD Steadmans Landing Rd
- 22A-23 Steadmans Landing Rd
- 0 Steadmans Landing Rd
- 00 Steadmans Landing Rd
- 58 Berce Way
- 607 Steadmans Landing Rd
- 523 Steadmans Landing Rd
- 625 Steadmans Landing Rd
- 25 Berce Way