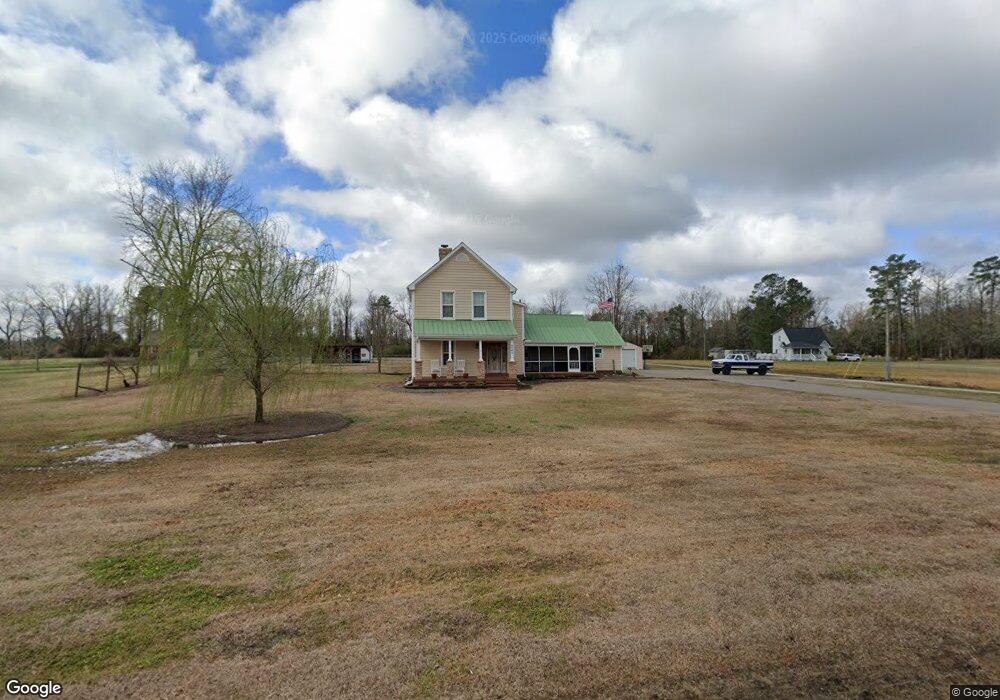
4560 Nc Highway 50 Maple Hill, NC 28454
Maple Hill NeighborhoodEstimated Value: $181,000 - $371,018
4
Beds
2
Baths
2,273
Sq Ft
$125/Sq Ft
Est. Value
About This Home
This home is located at 4560 Nc Highway 50, Maple Hill, NC 28454 and is currently estimated at $283,755, approximately $124 per square foot. 4560 Nc Highway 50 is a home located in Pender County with nearby schools including C. F. Pope Elementary School, Burgaw Middle School, and Heide Trask High School.
Ownership History
Date
Name
Owned For
Owner Type
Purchase Details
Closed on
Nov 9, 2021
Sold by
Reconnu Joe Arthur and Reconnu Kelly Anne
Bought by
Reconnu Joe Arthur and Reconnu Kelly Anne
Current Estimated Value
Home Financials for this Owner
Home Financials are based on the most recent Mortgage that was taken out on this home.
Original Mortgage
$145,271
Outstanding Balance
$133,153
Interest Rate
3.01%
Mortgage Type
VA
Estimated Equity
$150,602
Purchase Details
Closed on
Aug 19, 2014
Sold by
Whitenton Colleen
Bought by
Reconnu Joseph Arthur
Home Financials for this Owner
Home Financials are based on the most recent Mortgage that was taken out on this home.
Original Mortgage
$82,640
Interest Rate
4.2%
Mortgage Type
VA
Purchase Details
Closed on
May 11, 2011
Sold by
Whitenton Richard L and Whitenton Colleen M
Bought by
Whitenton Colleen and Whitenton Living Trust
Purchase Details
Closed on
Oct 12, 2007
Sold by
Machac Roxann Cowan and Machac Frank J
Bought by
Whitenton Richard Lee and Whitenton Colleen M
Create a Home Valuation Report for This Property
The Home Valuation Report is an in-depth analysis detailing your home's value as well as a comparison with similar homes in the area
Home Values in the Area
Average Home Value in this Area
Purchase History
| Date | Buyer | Sale Price | Title Company |
|---|---|---|---|
| Reconnu Joe Arthur | -- | None Available | |
| Reconnu Joseph Arthur | $8,000 | None Available | |
| Whitenton Colleen | -- | -- | |
| Whitenton Richard Lee | $97,500 | -- |
Source: Public Records
Mortgage History
| Date | Status | Borrower | Loan Amount |
|---|---|---|---|
| Open | Reconnu Joe Arthur | $145,271 | |
| Closed | Reconnu Joseph Arthur | $82,640 |
Source: Public Records
Tax History Compared to Growth
Tax History
| Year | Tax Paid | Tax Assessment Tax Assessment Total Assessment is a certain percentage of the fair market value that is determined by local assessors to be the total taxable value of land and additions on the property. | Land | Improvement |
|---|---|---|---|---|
| 2024 | $1,278 | $164,830 | $74,980 | $89,850 |
| 2023 | $1,278 | $164,830 | $74,980 | $89,850 |
| 2022 | $1,078 | $164,830 | $74,980 | $89,850 |
| 2021 | $847 | $122,650 | $74,980 | $47,670 |
| 2020 | $627 | $122,650 | $74,980 | $47,670 |
| 2019 | $353 | $88,676 | $74,980 | $13,696 |
| 2018 | $689 | $68,322 | $26,650 | $41,672 |
| 2017 | $689 | $68,322 | $26,650 | $41,672 |
| 2016 | $682 | $68,322 | $26,650 | $41,672 |
| 2015 | $757 | $68,322 | $26,650 | $41,672 |
| 2014 | $620 | $68,322 | $26,650 | $41,672 |
| 2013 | -- | $68,322 | $26,650 | $41,672 |
| 2012 | -- | $68,322 | $26,650 | $41,672 |
Source: Public Records
Map
Nearby Homes
- 500 Tomahawk Rd
- 332 Batchelor Bay Rd
- 117 Boysenberry Fields Rd
- 1300 Godwin Rd
- 49 N Carolina 50
- 90 N Carolina 50
- 44 N Carolina 50
- 0 Hardy Graham Rd
- 9626 N Carolina 50
- 260 Andermora Rd
- 5589 Burgaw Hwy
- L4 Brown Heritage Rd
- L 3 Brown Heritage Rd
- 108 Michelle Ward Ln
- 9433 Nc Highway 53 E
- 281 Shelter Creek Dr
- 0 Chadwick Unit 100526567
- 9183 N Carolina 53
- 0 Gurganus
- 724 Gurganus
- 4502 Nc Highway 50
- 4561 Nc Highway 50
- 4594 Nc Hwy 50
- 4630 Nc Hwy 50
- 4635 Nc Highway 50
- 73 Cypress Creek Rd
- 4688 Nc Highway 50
- 4415 Nc Highway 50
- 111 Cypress Creek Rd
- 4710 N Carolina 50
- 132 Cypress Creek Rd
- 4370 Nc Highway 50
- 4351 Nc Hwy 50
- 4811 N Carolina 50
- 284 Cypress Creek Rd
- 283 Cypress Creek Rd
- 4891 Nc Highway 50
- 15651 Nc Hwy 53 E
- 4205 Nc Highway 50
- 4111 Nc Hwy 50