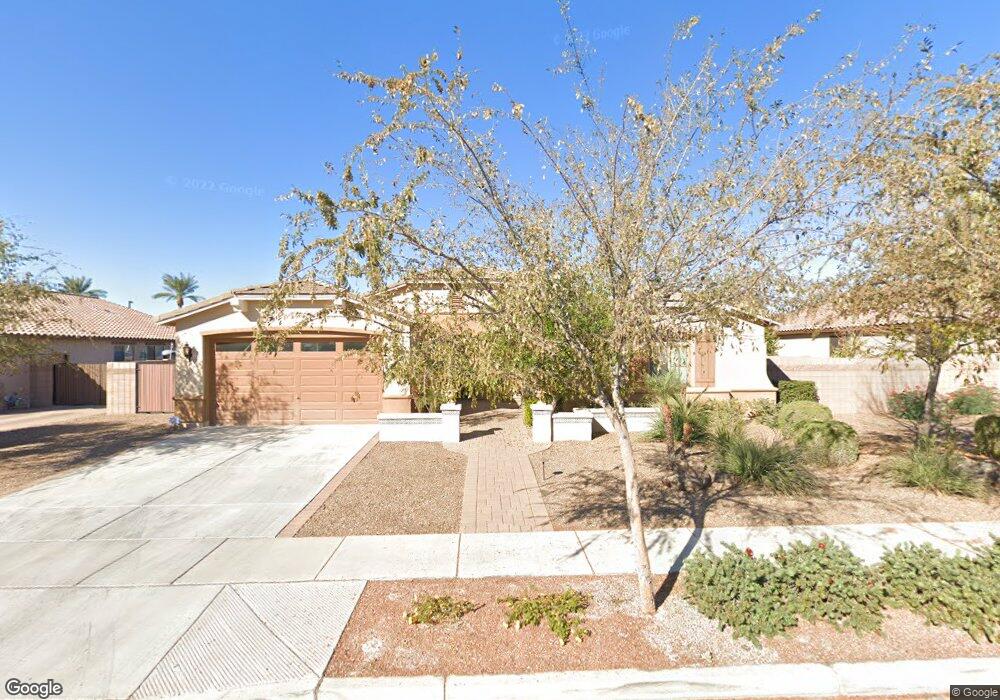
4560 S Sea Breeze Place Chandler, AZ 85248
Ocotillo NeighborhoodEstimated Value: $918,534 - $1,064,000
--
Bed
4
Baths
2,911
Sq Ft
$348/Sq Ft
Est. Value
About This Home
This home is located at 4560 S Sea Breeze Place, Chandler, AZ 85248 and is currently estimated at $1,011,884, approximately $347 per square foot. 4560 S Sea Breeze Place is a home located in Maricopa County with nearby schools including Fulton Elementary School, Hamilton High School, and Bogle Junior High School.
Ownership History
Date
Name
Owned For
Owner Type
Purchase Details
Closed on
Feb 8, 2021
Sold by
Sefton James T and Sefton Carla Gentry
Bought by
Sefton James T and Sefton Carla Gentry
Current Estimated Value
Home Financials for this Owner
Home Financials are based on the most recent Mortgage that was taken out on this home.
Original Mortgage
$300,000
Outstanding Balance
$268,085
Interest Rate
2.65%
Mortgage Type
New Conventional
Estimated Equity
$743,799
Purchase Details
Closed on
Sep 7, 2010
Sold by
Fulton Homes Sales Corporation
Bought by
Sefton James T and Gentry Carla M
Home Financials for this Owner
Home Financials are based on the most recent Mortgage that was taken out on this home.
Original Mortgage
$283,956
Interest Rate
4.45%
Mortgage Type
New Conventional
Create a Home Valuation Report for This Property
The Home Valuation Report is an in-depth analysis detailing your home's value as well as a comparison with similar homes in the area
Home Values in the Area
Average Home Value in this Area
Purchase History
| Date | Buyer | Sale Price | Title Company |
|---|---|---|---|
| Sefton James T | -- | Chicago Title Insurance Co | |
| Sefton James T | $443,956 | The Talon Group Tempe Supers | |
| Fulton Homes Sales Corporation | $303,699 | The Talon Group Tempe Supers |
Source: Public Records
Mortgage History
| Date | Status | Borrower | Loan Amount |
|---|---|---|---|
| Open | Sefton James T | $300,000 | |
| Closed | Sefton James T | $283,956 |
Source: Public Records
Tax History Compared to Growth
Tax History
| Year | Tax Paid | Tax Assessment Tax Assessment Total Assessment is a certain percentage of the fair market value that is determined by local assessors to be the total taxable value of land and additions on the property. | Land | Improvement |
|---|---|---|---|---|
| 2025 | $4,706 | $50,327 | -- | -- |
| 2024 | $4,542 | $47,930 | -- | -- |
| 2023 | $4,542 | $69,420 | $13,880 | $55,540 |
| 2022 | $4,398 | $51,100 | $10,220 | $40,880 |
| 2021 | $4,521 | $49,430 | $9,880 | $39,550 |
| 2020 | $4,496 | $45,910 | $9,180 | $36,730 |
| 2019 | $4,338 | $40,660 | $8,130 | $32,530 |
| 2018 | $4,214 | $40,330 | $8,060 | $32,270 |
| 2017 | $3,960 | $39,050 | $7,810 | $31,240 |
| 2016 | $3,825 | $41,360 | $8,270 | $33,090 |
| 2015 | $3,667 | $38,680 | $7,730 | $30,950 |
Source: Public Records
Map
Nearby Homes
- 4463 S Oregon Ct
- 577 W Horseshoe Place
- 4291 S California St
- 135 E Mead Dr
- 4303 S Oregon Ct
- 164 E Prescott Dr
- 245 E Mead Dr
- 610 W Tonto Dr
- 5070 S California St
- 639 W Coconino Place
- 272 E Bartlett Way
- 291 W Yellowstone Way
- 710 W Cherrywood Dr
- 402 W Beechnut Place
- 191 W Beechnut Place
- 721 W Cherrywood Dr
- 790 W Cherrywood Dr
- 4777 S Fulton Ranch Blvd Unit 1015
- 4777 S Fulton Ranch Blvd Unit 1016
- 4777 S Fulton Ranch Blvd Unit 1074
- 4550 S Sea Breeze Place
- 4570 S Sea Breeze Place
- 4540 S Sea Breeze Place
- 203 W Crescent Way
- 252 W Crescent Way
- 262 W Crescent Way
- 151 W Canyon Way
- 4530 S Sea Breeze Place
- 272 W Crescent Way
- 193 W Crescent Way
- 152 W Crescent Way
- 131 W Canyon Way
- 273 W Crescent Way
- 173 W Crescent Way
- 4520 S Sea Breeze Place
- 132 W Crescent Way
- 4551 S Ethan Place
- 4531 S Sea Breeze Place
- 111 W Canyon Way
- 153 W Crescent Way