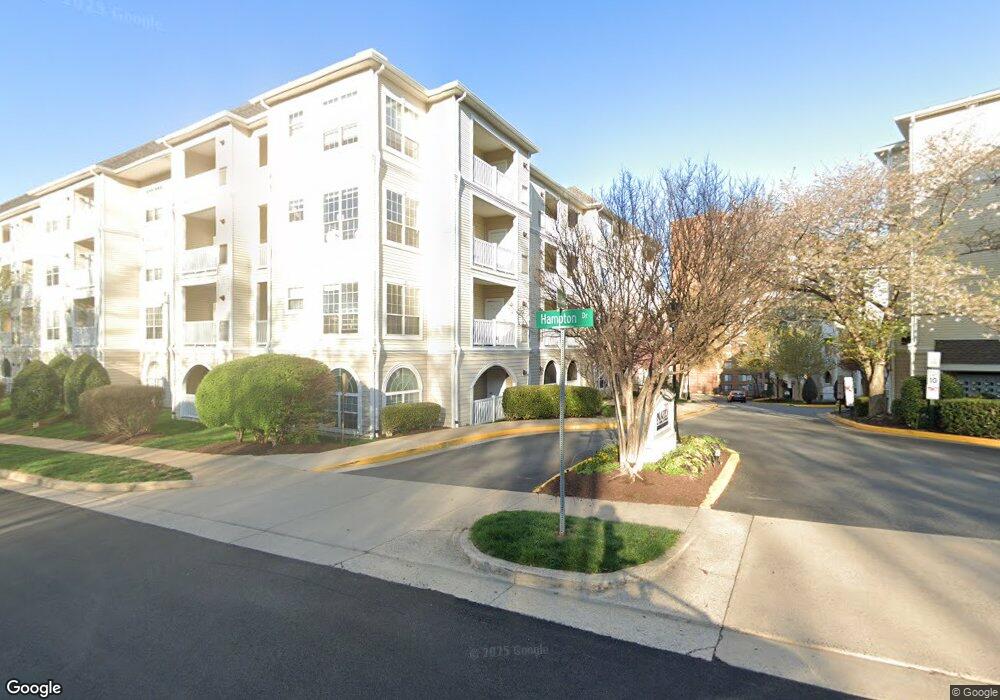
4561 Strutfield Ln Unit 3118 Alexandria, VA 22311
Alexandria West NeighborhoodEstimated Value: $374,000 - $420,000
2
Beds
1
Bath
878
Sq Ft
$446/Sq Ft
Est. Value
About This Home
This home is located at 4561 Strutfield Ln Unit 3118, Alexandria, VA 22311 and is currently estimated at $391,279, approximately $445 per square foot. 4561 Strutfield Ln Unit 3118 is a home located in Alexandria City with nearby schools including John Adams Elementary School, Francis C. Hammond Middle, and Alexandria City High School.
Ownership History
Date
Name
Owned For
Owner Type
Purchase Details
Closed on
Sep 27, 2011
Sold by
Wells Fargo Bank Na
Bought by
Acree Marcus D
Current Estimated Value
Home Financials for this Owner
Home Financials are based on the most recent Mortgage that was taken out on this home.
Original Mortgage
$219,296
Interest Rate
3.62%
Mortgage Type
FHA
Purchase Details
Closed on
Jan 12, 2011
Sold by
Commonwealth Trustees
Bought by
Wells Fargo Bank Na
Purchase Details
Closed on
Jan 10, 2006
Sold by
Palazzo At Park Center L
Bought by
Frank Sumra
Home Financials for this Owner
Home Financials are based on the most recent Mortgage that was taken out on this home.
Original Mortgage
$268,000
Interest Rate
6.28%
Mortgage Type
New Conventional
Create a Home Valuation Report for This Property
The Home Valuation Report is an in-depth analysis detailing your home's value as well as a comparison with similar homes in the area
Home Values in the Area
Average Home Value in this Area
Purchase History
| Date | Buyer | Sale Price | Title Company |
|---|---|---|---|
| Acree Marcus D | $225,000 | -- | |
| Wells Fargo Bank Na | $195,133 | -- | |
| Frank Sumra | $335,000 | -- |
Source: Public Records
Mortgage History
| Date | Status | Borrower | Loan Amount |
|---|---|---|---|
| Previous Owner | Acree Marcus D | $219,296 | |
| Previous Owner | Frank Sumra | $268,000 |
Source: Public Records
Tax History Compared to Growth
Tax History
| Year | Tax Paid | Tax Assessment Tax Assessment Total Assessment is a certain percentage of the fair market value that is determined by local assessors to be the total taxable value of land and additions on the property. | Land | Improvement |
|---|---|---|---|---|
| 2025 | $4,316 | $391,200 | $111,670 | $279,530 |
| 2024 | $4,316 | $372,448 | $106,607 | $265,841 |
| 2023 | $3,751 | $337,905 | $101,470 | $236,435 |
| 2022 | $3,681 | $331,652 | $99,480 | $232,172 |
| 2021 | $3,613 | $325,523 | $97,530 | $227,993 |
| 2020 | $3,280 | $295,929 | $88,663 | $207,266 |
| 2019 | $3,138 | $277,702 | $82,863 | $194,839 |
| 2018 | $3,138 | $277,702 | $82,863 | $194,839 |
| 2017 | $3,080 | $272,595 | $81,238 | $191,357 |
| 2016 | $2,871 | $267,589 | $79,645 | $187,944 |
| 2015 | $2,690 | $257,930 | $79,645 | $178,285 |
| 2014 | $2,462 | $236,055 | $72,405 | $163,650 |
Source: Public Records
Map
Nearby Homes
- 4550 Strutfield Ln Unit 2213
- 4561 Strutfield Ln Unit 3414
- 4561 Strutfield Ln Unit 3305
- 4561 Strutfield Ln Unit 3115
- 4551 Strutfield Ln Unit 4111
- 4551 Strutfield Ln Unit 4337
- 3307 Wyndham Cir Unit 3169
- 3307 Wyndham Cir Unit 4165
- 3101 N Hampton Dr Unit 407
- 4627 Knight Place
- 3309 Wyndham Cir Unit 3180
- 3311 Wyndham Cir Unit 1193
- 3315 Wyndham Cir Unit 1223
- 3210 S 28th St Unit 404
- 3230 S 28th St Unit 401
- 2942 S Columbus St Unit A2
- 3222 S 28th St Unit 304
- 2950 S Columbus St Unit C1
- 2990 S Columbus St
- 2949 S Columbus St Unit A2
- 4561 Strutfield Ln Unit 3401
- 4561 Strutfield Ln Unit 3109
- 4561 Strutfield Ln Unit 3416
- 4561 Strutfield Ln Unit 3111
- 4561 Strutfield Ln Unit 3211
- 4561 Strutfield Ln Unit 3407
- 4561 Strutfield Ln Unit 3417
- 4561 Strutfield Ln Unit 3114
- 4561 Strutfield Ln Unit 3214
- 4561 Strutfield Ln Unit 3112
- 4561 Strutfield Ln Unit 3418
- 4561 Strutfield Ln Unit 3104
- 4561 Strutfield Ln Unit 3116
- 4561 Strutfield Ln Unit 3314
- 4561 Strutfield Ln Unit 3210
- 4561 Strutfield Ln Unit 3204
- 4561 Strutfield Ln Unit 3205
- 4561 Strutfield Ln Unit 3411
- 4561 Strutfield Ln Unit 3209
- 4561 Strutfield Ln Unit 3309