Estimated Value: $343,153 - $404,000
3
Beds
1
Bath
1,125
Sq Ft
$332/Sq Ft
Est. Value
About This Home
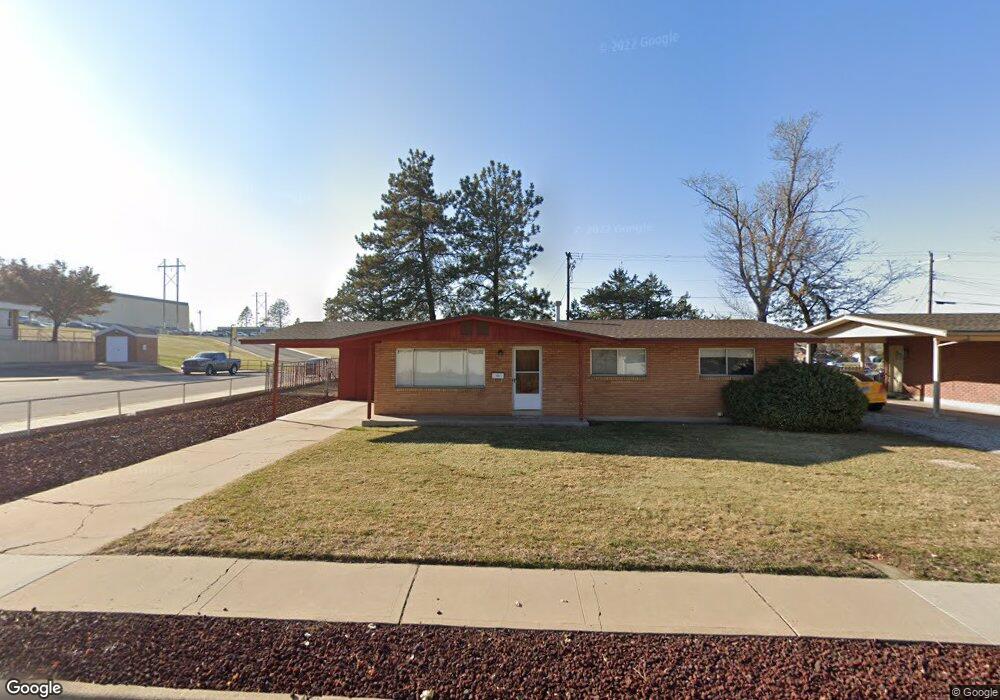
This home is located at 4563 S 2075 W, Roy, UT 84067 and is currently estimated at $374,038, approximately $332 per square foot. 4563 S 2075 W is a home located in Weber County with nearby schools including Valley View School, Sand Ridge Junior High School, and Roy High School.
Ownership History
Date
Name
Owned For
Owner Type
Purchase Details
Closed on
Mar 16, 2023
Sold by
Steele Mary J
Bought by
Mary J Steele Revocable Living Trust
Current Estimated Value
Purchase Details
Closed on
Nov 16, 2004
Sold by
Bonney Delmar D
Bought by
Bonney Stephen L and Steele Mary J
Home Financials for this Owner
Home Financials are based on the most recent Mortgage that was taken out on this home.
Original Mortgage
$85,000
Interest Rate
5.79%
Mortgage Type
Purchase Money Mortgage
Purchase Details
Closed on
Nov 2, 2004
Sold by
Bonney Delmar D
Bought by
Bonney Delmar D
Home Financials for this Owner
Home Financials are based on the most recent Mortgage that was taken out on this home.
Original Mortgage
$85,000
Interest Rate
5.79%
Mortgage Type
Purchase Money Mortgage
Purchase Details
Closed on
Aug 19, 2003
Sold by
Bonney Delmar D and Bonney Sheri Lynn
Bought by
Bonney Delmar D
Create a Home Valuation Report for This Property
The Home Valuation Report is an in-depth analysis detailing your home's value as well as a comparison with similar homes in the area
Home Values in the Area
Average Home Value in this Area
Purchase History
| Date | Buyer | Sale Price | Title Company |
|---|---|---|---|
| Mary J Steele Revocable Living Trust | -- | None Listed On Document | |
| Bonney Stephen L | -- | Backman Stewart Title | |
| Bonney Delmar D | -- | Backman Stewart Title | |
| Bonney Delmar D | -- | -- |
Source: Public Records
Mortgage History
| Date | Status | Borrower | Loan Amount |
|---|---|---|---|
| Previous Owner | Bonney Stephen L | $85,000 |
Source: Public Records
Tax History
| Year | Tax Paid | Tax Assessment Tax Assessment Total Assessment is a certain percentage of the fair market value that is determined by local assessors to be the total taxable value of land and additions on the property. | Land | Improvement |
|---|---|---|---|---|
| 2025 | $2,015 | $308,634 | $118,613 | $190,021 |
| 2024 | $1,970 | $167,199 | $65,237 | $101,962 |
| 2023 | $1,885 | $160,050 | $62,578 | $97,472 |
| 2022 | $1,723 | $149,050 | $57,284 | $91,766 |
| 2021 | $1,490 | $212,000 | $12,800 | $199,200 |
| 2020 | $1,425 | $187,000 | $12,800 | $174,200 |
| 2019 | $1,463 | $182,000 | $39,500 | $142,500 |
| 2018 | $1,359 | $158,000 | $34,460 | $123,540 |
| 2017 | $1,227 | $132,000 | $32,624 | $99,376 |
| 2016 | $1,203 | $69,738 | $19,375 | $50,363 |
| 2015 | $1,022 | $59,226 | $19,375 | $39,851 |
| 2014 | $998 | $57,003 | $19,375 | $37,628 |
Source: Public Records
Map
Nearby Homes
- 2038 W 4600 S
- 2015 W 4450 S
- 4642 S 1900 W Unit 41
- 4328 S 2175 W
- 4602 Hathaway Dr
- 4598 S Blossom Glen Way
- 2015 W 4225 S
- 4220 S 2075 W
- 4881 S 2400 W
- 1838 W 5050 S
- 2338 W 4250 S
- 1829 W 5050 S
- 1818 W 5050 S
- 4248 S 2400 W
- 1765 W 5000 S
- 2602 W 4600 S
- 1789 W 5050 S
- 1781 W 5050 S
- 4061 S 2175 W
- 1779 W 5125 S
Your Personal Tour Guide
Ask me questions while you tour the home.