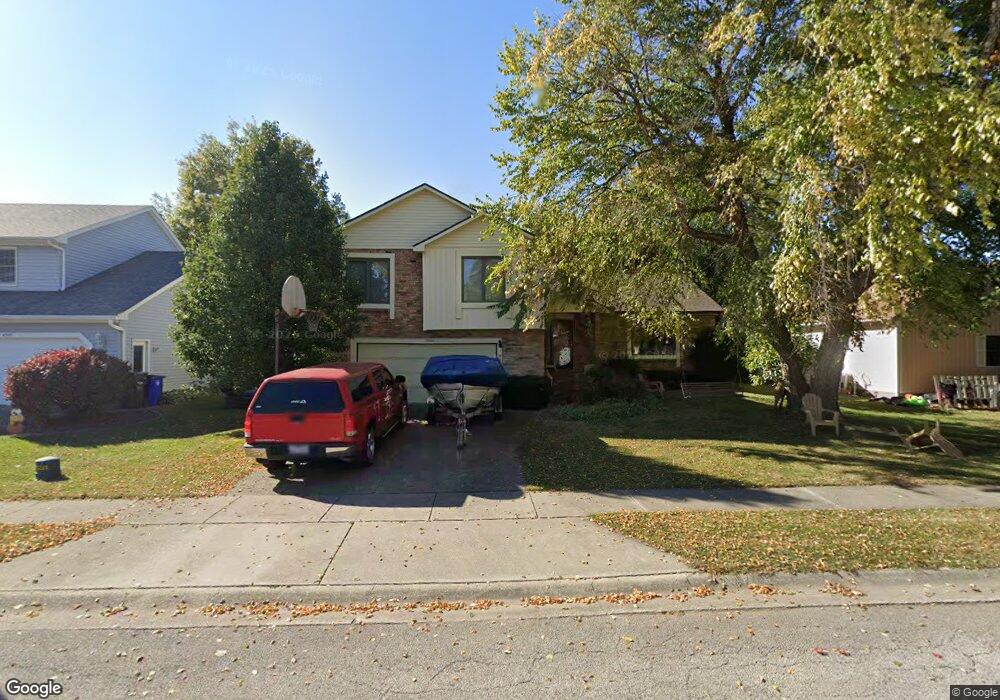
4565 Nicklaus Ct Decatur, IL 62526
Cresthaven NeighborhoodEstimated Value: $194,000 - $232,000
4
Beds
3
Baths
2,035
Sq Ft
$106/Sq Ft
Est. Value
About This Home
This home is located at 4565 Nicklaus Ct, Decatur, IL 62526 and is currently estimated at $215,879, approximately $106 per square foot. 4565 Nicklaus Ct is a home located in Macon County with nearby schools including Parsons Elementary School, Stephen Decatur Middle School, and Our Lady of Lourdes School.
Ownership History
Date
Name
Owned For
Owner Type
Purchase Details
Closed on
Oct 8, 2016
Sold by
Taylor Richard and Taylor Sharon
Bought by
Taylor Richard and Richard A & Sharon J Taylor Re
Current Estimated Value
Purchase Details
Closed on
Feb 14, 2015
Sold by
Taylor Richard and Taylor Sharon
Bought by
Taylor Richard and Taylor Sharon
Home Financials for this Owner
Home Financials are based on the most recent Mortgage that was taken out on this home.
Original Mortgage
$75,400
Outstanding Balance
$25,780
Interest Rate
2.97%
Mortgage Type
New Conventional
Estimated Equity
$190,099
Purchase Details
Closed on
Oct 20, 2008
Sold by
Mclaughlan John N and Mclaughlan Susan K
Bought by
Taylor Richard A and Taylor Sharon J
Home Financials for this Owner
Home Financials are based on the most recent Mortgage that was taken out on this home.
Original Mortgage
$56,500
Interest Rate
5.94%
Mortgage Type
Future Advance Clause Open End Mortgage
Purchase Details
Closed on
Jun 1, 2000
Create a Home Valuation Report for This Property
The Home Valuation Report is an in-depth analysis detailing your home's value as well as a comparison with similar homes in the area
Home Values in the Area
Average Home Value in this Area
Purchase History
| Date | Buyer | Sale Price | Title Company |
|---|---|---|---|
| Taylor Richard | -- | None Available | |
| Taylor Richard | -- | None Available | |
| Taylor Richard A | $166,500 | None Available | |
| -- | $140,000 | -- |
Source: Public Records
Mortgage History
| Date | Status | Borrower | Loan Amount |
|---|---|---|---|
| Open | Taylor Richard | $75,400 | |
| Closed | Taylor Richard A | $56,500 | |
| Closed | Taylor Richard A | $85,000 |
Source: Public Records
Tax History
| Year | Tax Paid | Tax Assessment Tax Assessment Total Assessment is a certain percentage of the fair market value that is determined by local assessors to be the total taxable value of land and additions on the property. | Land | Improvement |
|---|---|---|---|---|
| 2024 | $5,145 | $63,109 | $8,857 | $54,252 |
| 2023 | $4,736 | $58,015 | $8,142 | $49,873 |
| 2022 | $4,422 | $53,808 | $7,552 | $46,256 |
| 2021 | $4,123 | $50,750 | $7,061 | $43,689 |
| 2020 | $4,128 | $49,700 | $6,915 | $42,785 |
| 2019 | $4,128 | $49,700 | $6,915 | $42,785 |
| 2018 | $4,114 | $50,055 | $6,964 | $43,091 |
| 2017 | $4,134 | $50,334 | $7,003 | $43,331 |
| 2016 | $4,177 | $50,455 | $7,020 | $43,435 |
| 2015 | $3,974 | $49,857 | $6,937 | $42,920 |
| 2014 | $3,724 | $49,857 | $6,937 | $42,920 |
| 2013 | $3,710 | $49,857 | $6,937 | $42,920 |
Source: Public Records
Map
Nearby Homes
- 4643 Nicklaus Ct
- 757 W Harold Cir
- 4505 Shadow Dr
- 4316 N Leonore Dr
- 4086 Arthur Ct
- 880 W Frank Dr
- 3994 N Northbrook Dr
- 4616 Lawson Dr
- 0 Route 51 Unit 6241333
- 630 Montgomery Ln
- 13 Lantern Ln
- 5322 Navajo Dr
- 920 W Karen Dr
- 113 Benton Dr
- 89 Benton Dr
- 110 W Manchester Dr
- 3448 N Taylor Ave
- 1450 Riedel Ave
- 53 N Lynette Dr
- 880 Stevens Creek Ln
- 4575 Nicklaus Ct
- 4545 Nicklaus Ct
- 4525 N Nicklaus
- 4525 Nicklaus Ct
- 4595 Nicklaus Ct
- 4524 Nicklaus Ct
- 4574 Nicklaus Ct
- 4514 Nicklaus Ct
- 4603 Nicklaus Ct
- 4594 Nicklaus Ct
- 4515 Nicklaus Ct
- 4604 Nicklaus Ct
- 4613 Nicklaus Ct
- 1050 Bunker Ln
- 4567 Cresthaven Ln
- 4614 Nicklaus Ct
- 4505 Nicklaus Ct
- 4595 Cresthaven Ln
- 4623 Nicklaus Ct
- 1040 Bunker Ln
Your Personal Tour Guide
Ask me questions while you tour the home.