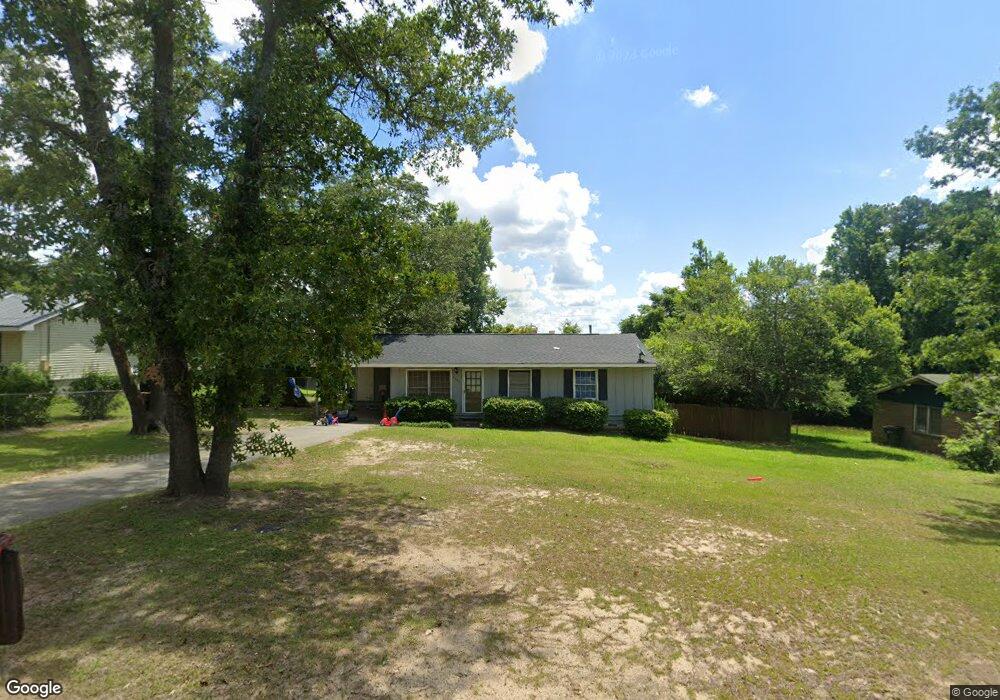
4566 Bishop Rd Macon, GA 31206
Estimated Value: $66,000 - $96,925
3
Beds
2
Baths
960
Sq Ft
$88/Sq Ft
Est. Value
About This Home
This home is located at 4566 Bishop Rd, Macon, GA 31206 and is currently estimated at $84,481, approximately $88 per square foot. 4566 Bishop Rd is a home located in Bibb County with nearby schools including Veterans Elementary School, Weaver Middle School, and Westside High School.
Ownership History
Date
Name
Owned For
Owner Type
Purchase Details
Closed on
Oct 16, 2020
Sold by
Wallace John D
Bought by
Nash Graham
Current Estimated Value
Purchase Details
Closed on
Jul 17, 2006
Sold by
Wallace John D
Bought by
Barrett Family Trust
Home Financials for this Owner
Home Financials are based on the most recent Mortgage that was taken out on this home.
Original Mortgage
$58,000
Interest Rate
6.6%
Mortgage Type
New Conventional
Purchase Details
Closed on
Jun 13, 2003
Create a Home Valuation Report for This Property
The Home Valuation Report is an in-depth analysis detailing your home's value as well as a comparison with similar homes in the area
Home Values in the Area
Average Home Value in this Area
Purchase History
| Date | Buyer | Sale Price | Title Company |
|---|---|---|---|
| Nash Graham | $46,500 | None Available | |
| Barrett Family Trust | $58,000 | None Avilebel | |
| -- | $34,000 | -- |
Source: Public Records
Mortgage History
| Date | Status | Borrower | Loan Amount |
|---|---|---|---|
| Previous Owner | Barrett Family Trust | $58,000 |
Source: Public Records
Tax History Compared to Growth
Tax History
| Year | Tax Paid | Tax Assessment Tax Assessment Total Assessment is a certain percentage of the fair market value that is determined by local assessors to be the total taxable value of land and additions on the property. | Land | Improvement |
|---|---|---|---|---|
| 2025 | $764 | $31,092 | $3,344 | $27,748 |
| 2024 | $790 | $31,092 | $3,344 | $27,748 |
| 2023 | $665 | $26,199 | $3,040 | $23,159 |
| 2022 | $729 | $21,062 | $3,271 | $17,791 |
| 2021 | $674 | $17,744 | $3,176 | $14,568 |
| 2020 | $638 | $16,427 | $3,176 | $13,251 |
| 2019 | $643 | $16,427 | $3,176 | $13,251 |
| 2018 | $1,165 | $16,427 | $3,176 | $13,251 |
| 2017 | $804 | $21,471 | $4,996 | $16,475 |
| 2016 | $743 | $21,471 | $4,996 | $16,475 |
| 2015 | $1,051 | $21,471 | $4,996 | $16,475 |
| 2014 | $1,053 | $21,471 | $4,996 | $16,475 |
Source: Public Records
Map
Nearby Homes
- 4559 Massey Rd
- 4501 Massey Rd
- 4722 Bishop Rd
- 4622 Wilson Rd
- 4506 Ebenezer Church Rd
- 4527 Wilson Rd
- 4712 Brookhaven Rd
- 4453 Pharr Ave
- 4376 Log Cabin
- 3896 Log Cabin Dr
- 4158 Log Cabin Dr
- 4090 W Oak Dr
- 4112 W Hickory Ct
- 4015 Dellwood Dr
- 3850 Gadson Dr
- 4500 Chambers Rd
- 4032 Winding Way Ct
- 4742 Bloomfield Rd