4566 Denaro Dr Las Vegas, NV 89135
South Summerlin NeighborhoodEstimated Value: $742,000 - $788,000
2
Beds
2
Baths
2,306
Sq Ft
$332/Sq Ft
Est. Value
About This Home
This home is located at 4566 Denaro Dr, Las Vegas, NV 89135 and is currently estimated at $765,917, approximately $332 per square foot. 4566 Denaro Dr is a home located in Clark County with nearby schools including Sandra B Abston Elementary School, Victoria Fertitta Middle School, and Durango High School.
Ownership History
Date
Name
Owned For
Owner Type
Purchase Details
Closed on
Aug 27, 2021
Sold by
Pearsall Mark and Pearsall Rebecca
Bought by
Pearsall Mark and Pearsall Rebecca
Current Estimated Value
Purchase Details
Closed on
Aug 20, 2018
Sold by
Bootzin Jerold Wayne and Bootzin Charlene Judy
Bought by
Pearsall Mark and Pearsall Rebecca
Purchase Details
Closed on
Mar 7, 2014
Sold by
Degaugh William C and Degaugh Louise
Bought by
Bootzin Jerold Wayne and Bootzin Charlene Judy
Purchase Details
Closed on
Aug 19, 2011
Sold by
Lagrange Sharon K and Lagrange Thomas Bradley
Bought by
Degaugh William C and Degaugh Louise
Purchase Details
Closed on
Jun 30, 2008
Sold by
Brodi Steve
Bought by
Brodi Steve and Steve & Shirley Brodi Living Trust
Purchase Details
Closed on
Aug 17, 2001
Sold by
Brodi Steve and Brodi Shriley Jean
Bought by
Brodi Steve and Brodi Shirley J
Purchase Details
Closed on
Dec 6, 2000
Sold by
Sun Colony Summerlin Homes Llc
Bought by
Brodi Steve and Brodi Shirley Jean
Create a Home Valuation Report for This Property
The Home Valuation Report is an in-depth analysis detailing your home's value as well as a comparison with similar homes in the area
Home Values in the Area
Average Home Value in this Area
Purchase History
| Date | Buyer | Sale Price | Title Company |
|---|---|---|---|
| Pearsall Mark | -- | None Available | |
| Pearsall Mark | $449,000 | Noble Title | |
| Bootzin Jerold Wayne | $390,000 | Ticor Title Las Vegas | |
| Degaugh William C | $300,000 | Fidelity National Title Las | |
| Brodi Steve | -- | None Available | |
| Brodi Steve | -- | -- | |
| Brodi Steve | $294,065 | Nevada Title Company |
Source: Public Records
Tax History Compared to Growth
Tax History
| Year | Tax Paid | Tax Assessment Tax Assessment Total Assessment is a certain percentage of the fair market value that is determined by local assessors to be the total taxable value of land and additions on the property. | Land | Improvement |
|---|---|---|---|---|
| 2025 | $3,516 | $164,986 | $65,450 | $99,536 |
| 2024 | $3,516 | $164,986 | $65,450 | $99,536 |
| 2023 | $3,516 | $141,280 | $46,900 | $94,380 |
| 2022 | $3,414 | $126,151 | $39,900 | $86,251 |
| 2021 | $3,314 | $119,099 | $37,100 | $81,999 |
| 2020 | $3,215 | $114,732 | $33,600 | $81,132 |
| 2019 | $3,121 | $111,413 | $31,500 | $79,913 |
| 2018 | $3,030 | $103,325 | $26,250 | $77,075 |
| 2017 | $3,102 | $104,330 | $27,563 | $76,767 |
| 2016 | $2,883 | $109,480 | $33,075 | $76,405 |
| 2015 | $2,878 | $95,557 | $20,213 | $75,344 |
| 2014 | $2,788 | $90,804 | $18,375 | $72,429 |
Source: Public Records
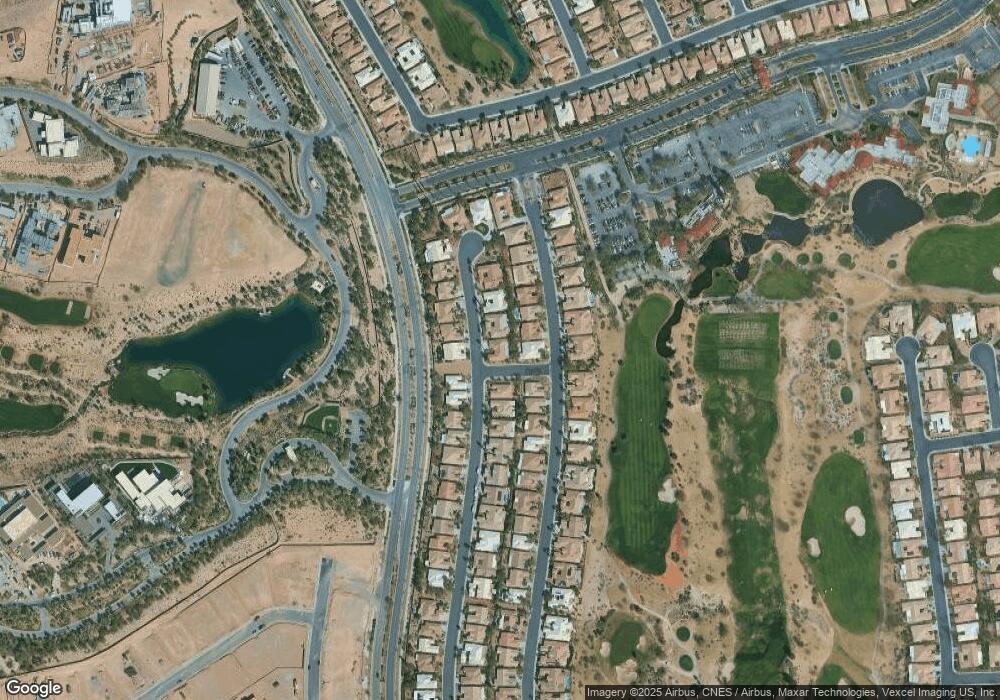
Map
Nearby Homes
- 4596 Bersaglio St
- 4507 Denaro Dr
- 10679 Riva de Fiore Ave
- 4439 Bella Cascada St
- 4415 Bella Cascada St
- 4555 Riva de Romanza St
- 4750 Outlook Peak St
- 4379 Bella Cascada St
- 4401 Angelo Rosa St
- 4778 Outlook Peak St
- 4636 Riva de Romanza St Unit 9
- 10463 Luna Magico Ave
- 10606 Mandarino Ave Unit 1A
- 10911 Discovery Peak Ct
- 4719 Riva de Romanza St
- 10550 Mandarino Ave
- 4312 Veraz St
- 10534 Mandarino Ave
- 4618 Atlantico St
- 10945 Horizon Ledge Ave
- 4556 Denaro Dr
- 4565 Bersaglio St
- 4574 Denaro Dr
- 4563 Denaro Dr
- 4549 Bersaglio St
- 4573 Bersaglio St
- 4546 Denaro Dr
- 4555 Denaro Dr
- 4573 Denaro Dr
- 4580 Denaro Dr
- 4541 Bersaglio St
- 4581 Bersaglio St
- 4547 Denaro Dr
- 4579 Denaro Dr
- 4586 Denaro Dr
- 4536 Denaro Dr
- 4589 Bersaglio St
- 4585 Denaro Dr
- 4533 Bersaglio St
- 4537 Denaro Dr