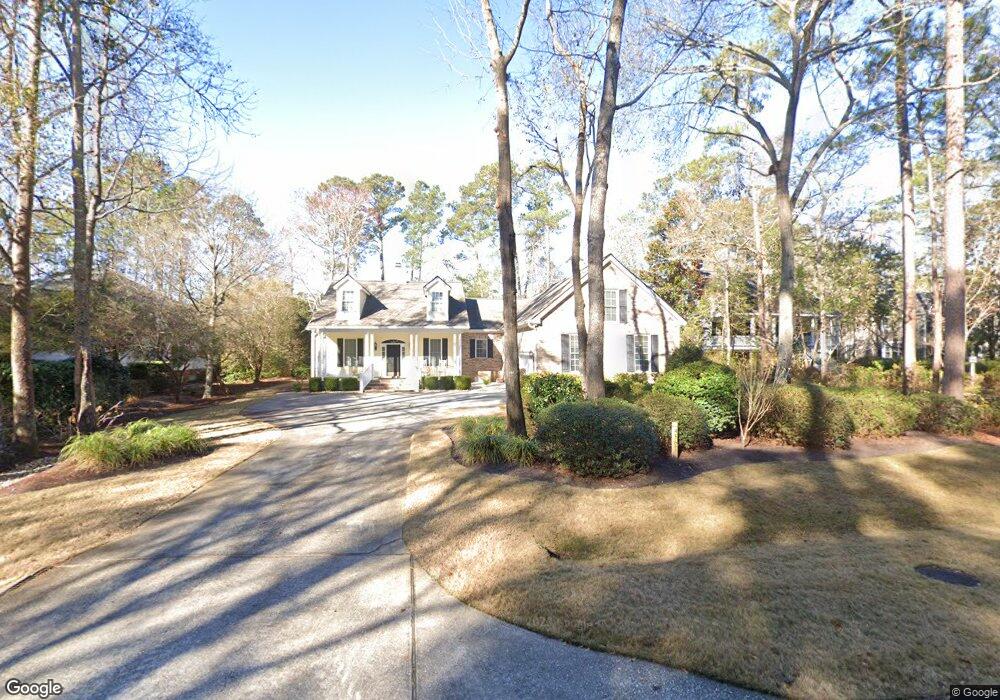
4567 Carriage Run Cir Unit Located on the 5th F Murrells Inlet, SC 29576
Wachesaw Plantation NeighborhoodEstimated Value: $667,000 - $696,000
5
Beds
4
Baths
3,600
Sq Ft
$189/Sq Ft
Est. Value
About This Home
This home is located at 4567 Carriage Run Cir Unit Located on the 5th F, Murrells Inlet, SC 29576 and is currently estimated at $679,466, approximately $188 per square foot. 4567 Carriage Run Cir Unit Located on the 5th F is a home located in Georgetown County with nearby schools including Waccamaw Elementary School, Waccamaw Intermediate School, and Waccamaw Middle School.
Ownership History
Date
Name
Owned For
Owner Type
Purchase Details
Closed on
Mar 11, 2025
Sold by
Sharon K Reder Revocable Living Trust and Reder Sharon K
Bought by
Hinckley Robert R and Hinckley Kathleen M
Current Estimated Value
Home Financials for this Owner
Home Financials are based on the most recent Mortgage that was taken out on this home.
Original Mortgage
$575,000
Outstanding Balance
$572,102
Interest Rate
6.95%
Mortgage Type
New Conventional
Estimated Equity
$107,364
Purchase Details
Closed on
Nov 13, 2018
Sold by
Reder Sharon K
Bought by
Livin Reder Sharon K and Livin Sharon K Reder Revocable
Purchase Details
Closed on
Oct 29, 2001
Sold by
Concannon William G
Bought by
Reder Chester A and Reder Sharon K
Purchase Details
Closed on
Oct 22, 1999
Sold by
Wilkerson Forest R and Wilkerson Dixie M
Bought by
Concannon William G
Create a Home Valuation Report for This Property
The Home Valuation Report is an in-depth analysis detailing your home's value as well as a comparison with similar homes in the area
Home Values in the Area
Average Home Value in this Area
Purchase History
| Date | Buyer | Sale Price | Title Company |
|---|---|---|---|
| Hinckley Robert R | $675,000 | None Listed On Document | |
| Hinckley Robert R | $675,000 | None Listed On Document | |
| Livin Reder Sharon K | -- | None Available | |
| Reder Chester A | $350,000 | -- | |
| Concannon William G | $68,400 | -- |
Source: Public Records
Mortgage History
| Date | Status | Borrower | Loan Amount |
|---|---|---|---|
| Open | Hinckley Robert R | $575,000 | |
| Closed | Hinckley Robert R | $575,000 |
Source: Public Records
Tax History Compared to Growth
Tax History
| Year | Tax Paid | Tax Assessment Tax Assessment Total Assessment is a certain percentage of the fair market value that is determined by local assessors to be the total taxable value of land and additions on the property. | Land | Improvement |
|---|---|---|---|---|
| 2024 | $1,877 | $14,900 | $3,000 | $11,900 |
| 2023 | $1,877 | $14,900 | $3,000 | $11,900 |
| 2022 | $1,575 | $14,900 | $3,000 | $11,900 |
| 2021 | $1,526 | $14,904 | $3,000 | $11,904 |
| 2020 | $1,522 | $14,904 | $3,000 | $11,904 |
| 2019 | $1,579 | $15,144 | $3,364 | $11,780 |
| 2018 | $1,579 | $151,440 | $0 | $0 |
| 2017 | $1,377 | $15,144 | $0 | $0 |
| 2016 | $1,363 | $15,144 | $0 | $0 |
| 2015 | $1,354 | $0 | $0 | $0 |
| 2014 | $1,296 | $365,900 | $84,100 | $281,800 |
| 2012 | -- | $365,900 | $84,100 | $281,800 |
Source: Public Records
Map
Nearby Homes
- 4691 Mill Pond Ct
- 4504 Fulton Place
- 4004 Bayfield Loop
- 1099 Wachesaw Rd
- 1095 Wachesaw Rd
- 1201 Wachesaw Rd
- 35 Easter Lilly Ct
- Lot 3 Shun Ave
- 1444 Will Go Ave
- 10 Logan Berry Ct Unit H
- Sterling Plan at Northbrook
- 55 Northbrook Dr
- Leyland Plan at Northbrook
- Reynolds Plan at Northbrook
- Hickory Plan at Northbrook
- Ivey Plan at Northbrook
- Persimmon Plan at Northbrook
- 65 Northbrook Dr
- 4502 Firethorne Dr
- 853 Wachesaw Rd
- 4565 Carriage Run Cir
- 4571 Carriage Run Cir
- 4563 Carriage Run Cir
- 4620 Burnt Oak Ct
- 4621 Burnt Oak Ct
- 4621 Burnt Oak Ct Unit Wachesaw Plantation
- 4615 Burnt Oak Ct
- 4573 Carriage Run Cir
- 4561 Carriage Run Cir
- 4572 Carriage Run Cir Unit Completely Renovated
- 4572 Carriage Run Cir Unit Wachesaw Plantation
- 4572 Carriage Run Cir
- 4622 Burnt Oak Ct
- 4623 Burnt Oak Ct
- 4623 Burnt Oak Ct Unit Wachesaw Plantation
- 4623 Burnt Oak Ct Unit Historic Wachesaw Pl
- 4691 Mill Pond Ct Unit Wachesaw Plantation
- 4691 Mill Pond Rd
- 4575 Carriage Run Cir
- 4559 Carriage Run Cir