Estimated Value: $424,000 - $437,000
4
Beds
2
Baths
2,336
Sq Ft
$185/Sq Ft
Est. Value
About This Home
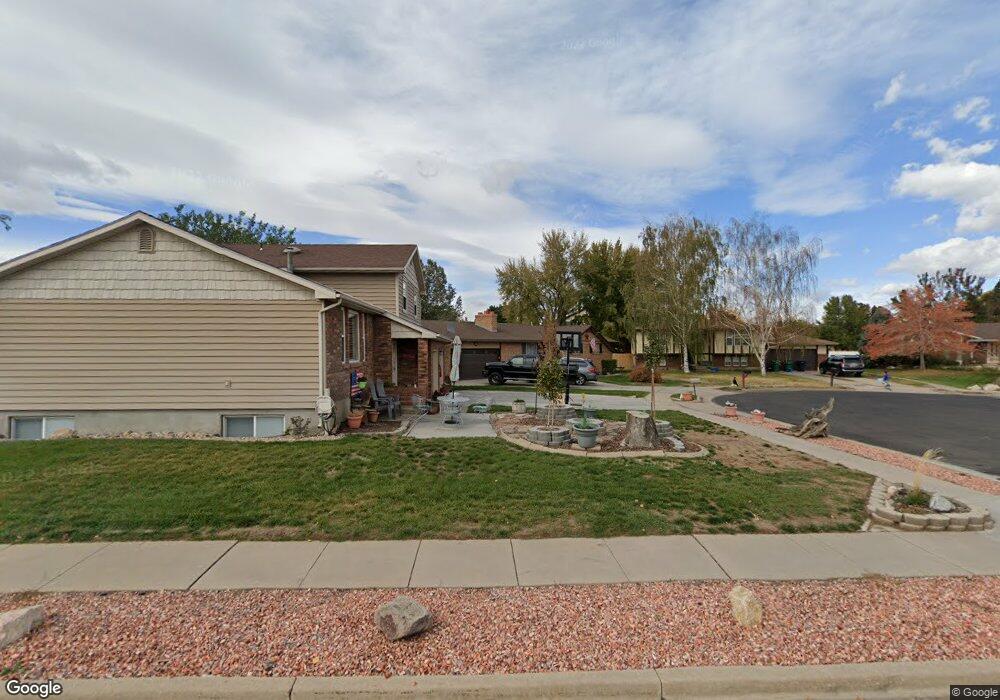
This home is located at 4567 S 1600 W, Roy, UT 84067 and is currently estimated at $431,385, approximately $184 per square foot. 4567 S 1600 W is a home located in Weber County with nearby schools including Valley View School, Sand Ridge Junior High School, and Roy High School.
Ownership History
Date
Name
Owned For
Owner Type
Purchase Details
Closed on
Jan 20, 2021
Sold by
Quintana Daniel
Bought by
Quintana Daniel and Quintan Amanda
Current Estimated Value
Home Financials for this Owner
Home Financials are based on the most recent Mortgage that was taken out on this home.
Original Mortgage
$196,000
Outstanding Balance
$174,900
Interest Rate
2.7%
Mortgage Type
New Conventional
Estimated Equity
$256,485
Purchase Details
Closed on
Jan 12, 2016
Sold by
Fackrell Jayson T
Bought by
Quintana Daniel
Home Financials for this Owner
Home Financials are based on the most recent Mortgage that was taken out on this home.
Original Mortgage
$6,637
Interest Rate
3.94%
Mortgage Type
Stand Alone Second
Purchase Details
Closed on
Jan 28, 2003
Sold by
Copps Norma A
Bought by
Fackrell Jayson T
Home Financials for this Owner
Home Financials are based on the most recent Mortgage that was taken out on this home.
Original Mortgage
$112,000
Interest Rate
5.75%
Create a Home Valuation Report for This Property
The Home Valuation Report is an in-depth analysis detailing your home's value as well as a comparison with similar homes in the area
Home Values in the Area
Average Home Value in this Area
Purchase History
We collect this data history from publicly available records. To have your information removed, we recommend requesting removal directly through your county’s website.
| Date | Buyer | Sale Price | Title Company |
|---|---|---|---|
| Quintana Daniel | -- | Servicelink | |
| Quintana Daniel | -- | North American Title | |
| Fackrell Jayson T | -- | Inwest Title |
Source: Public Records
Mortgage History
We collect this data history from publicly available records. To have your information removed, we recommend requesting removal directly through your county’s website.
| Date | Status | Borrower | Loan Amount |
|---|---|---|---|
| Open | Quintana Daniel | $196,000 | |
| Closed | Quintana Daniel | $6,637 | |
| Closed | Quintana Daniel | $165,938 | |
| Previous Owner | Fackrell Jayson T | $112,000 | |
| Closed | Fackrell Jayson T | $28,000 |
Source: Public Records
Tax History
| Year | Tax Paid | Tax Assessment Tax Assessment Total Assessment is a certain percentage of the fair market value that is determined by local assessors to be the total taxable value of land and additions on the property. | Land | Improvement |
|---|---|---|---|---|
| 2025 | $2,586 | $409,362 | $147,947 | $261,415 |
| 2024 | $2,527 | $221,649 | $81,378 | $140,271 |
| 2023 | $2,442 | $214,500 | $79,472 | $135,028 |
| 2022 | $2,341 | $210,650 | $63,666 | $146,984 |
| 2021 | $2,010 | $298,000 | $81,879 | $216,121 |
| 2020 | $1,822 | $247,000 | $81,879 | $165,121 |
| 2019 | $1,848 | $237,000 | $47,433 | $189,567 |
| 2018 | $1,707 | $205,000 | $42,600 | $162,400 |
| 2017 | $1,580 | $177,000 | $42,600 | $134,400 |
| 2016 | $1,552 | $93,657 | $23,759 | $69,898 |
| 2015 | $1,387 | $85,039 | $21,102 | $63,937 |
| 2014 | $1,314 | $79,059 | $21,102 | $57,957 |
Source: Public Records
Map
Nearby Homes
- 1639 W 4575 S
- 4598 S Blossom Glen Way
- 1766 W 4575 S
- 4539 S 1800 W Unit 127
- 4827 S 1800 W Unit 32
- 1198 W 4400 S Unit V
- 1198 W 4400 S Unit T
- 1838 W 5050 S
- 1818 W 5050 S
- 1814 W 5050 S
- 1215 W 4700 S
- 1865 W 5050 S
- 4697 S 2025 W
- 1805 W 5050 S
- 1187 4700 S
- 1789 W 5050 S
- 1781 W 5050 S
- 5092 S 1800 W
- 2015 W 4225 S
- 5124 S 1275 W
Your Personal Tour Guide
Ask me questions while you tour the home.