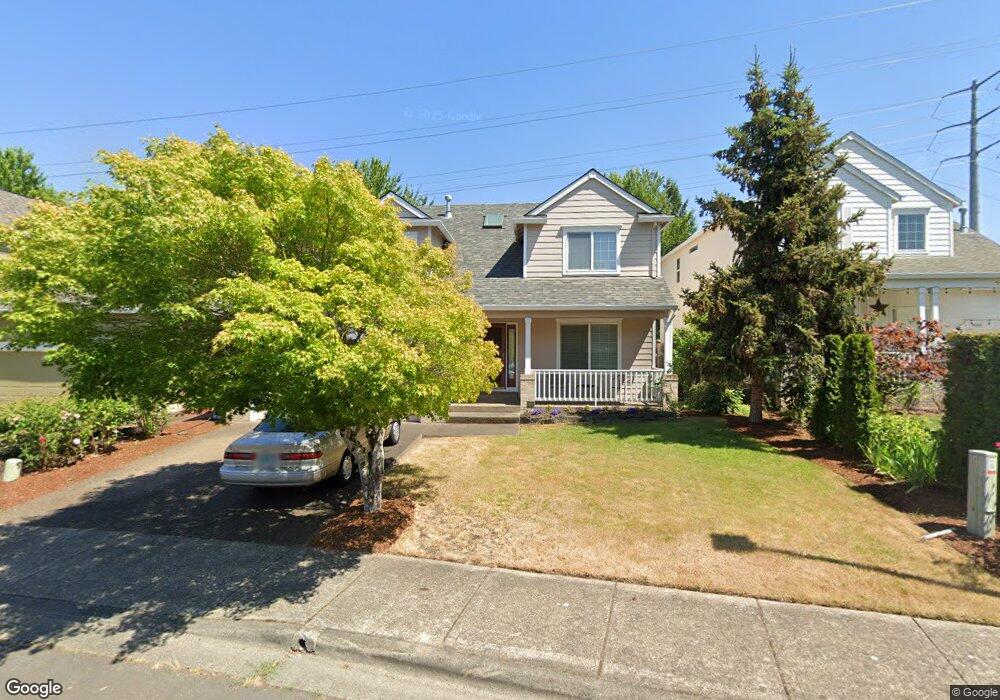
4568 NW 166th Ave Portland, OR 97229
Estimated Value: $668,012 - $717,000
4
Beds
7
Baths
2,325
Sq Ft
$301/Sq Ft
Est. Value
About This Home
This home is located at 4568 NW 166th Ave, Portland, OR 97229 and is currently estimated at $699,253, approximately $300 per square foot. 4568 NW 166th Ave is a home located in Washington County with nearby schools including Rock Creek Elementary School, Five Oaks Middle School, and Westview High School.
Ownership History
Date
Name
Owned For
Owner Type
Purchase Details
Closed on
Mar 23, 2006
Sold by
Ng Patty and Ng Liana
Bought by
Siddiqi Faraz Ahmad and Nakamoto Miwako
Current Estimated Value
Home Financials for this Owner
Home Financials are based on the most recent Mortgage that was taken out on this home.
Original Mortgage
$260,000
Outstanding Balance
$147,028
Interest Rate
6.18%
Mortgage Type
Fannie Mae Freddie Mac
Estimated Equity
$552,225
Purchase Details
Closed on
Dec 1, 2003
Sold by
Kartchner Shirard and Buckner Steven D
Bought by
Ng Liana and Ng Patty
Purchase Details
Closed on
Sep 16, 1999
Sold by
American Homes Inc
Bought by
Kartchner Shirard and Buckner Steven D
Home Financials for this Owner
Home Financials are based on the most recent Mortgage that was taken out on this home.
Original Mortgage
$219,656
Interest Rate
7.89%
Create a Home Valuation Report for This Property
The Home Valuation Report is an in-depth analysis detailing your home's value as well as a comparison with similar homes in the area
Home Values in the Area
Average Home Value in this Area
Purchase History
| Date | Buyer | Sale Price | Title Company |
|---|---|---|---|
| Siddiqi Faraz Ahmad | $400,000 | Lawyers Title Ins | |
| Ng Liana | $259,900 | Fidelity Natl Title Co Of Or | |
| Kartchner Shirard | $226,450 | Transnation Title Insurance |
Source: Public Records
Mortgage History
| Date | Status | Borrower | Loan Amount |
|---|---|---|---|
| Open | Siddiqi Faraz Ahmad | $260,000 | |
| Previous Owner | Kartchner Shirard | $219,656 |
Source: Public Records
Tax History Compared to Growth
Tax History
| Year | Tax Paid | Tax Assessment Tax Assessment Total Assessment is a certain percentage of the fair market value that is determined by local assessors to be the total taxable value of land and additions on the property. | Land | Improvement |
|---|---|---|---|---|
| 2025 | $5,796 | $357,030 | -- | -- |
| 2024 | $5,584 | $346,640 | -- | -- |
| 2023 | $5,584 | $336,550 | $0 | $0 |
| 2022 | $5,398 | $336,550 | $0 | $0 |
| 2021 | $5,196 | $317,240 | $0 | $0 |
| 2020 | $5,039 | $308,000 | $0 | $0 |
| 2019 | $4,863 | $299,030 | $0 | $0 |
| 2018 | $4,701 | $290,330 | $0 | $0 |
| 2017 | $4,531 | $281,880 | $0 | $0 |
| 2016 | $4,364 | $273,670 | $0 | $0 |
| 2015 | $4,197 | $265,700 | $0 | $0 |
| 2014 | $4,089 | $257,970 | $0 | $0 |
Source: Public Records
Map
Nearby Homes
- 16901 NW Desert Canyon Dr
- 16629 NW Countryridge Dr
- 16713 NW Countryridge Dr
- 16190 NW Canterwood Way
- 16629 NW Charlais St
- 15989 NW Claremont Dr
- 4884 NW 162nd Terrace
- 17213 NW Oak Creek Dr
- 4813 NW Blandy Terrace
- 16117 NW Hildago Ln
- 4618 NW Brassie Place
- 4891 NW Blandy Terrace
- Lot 1 Plan at Creekside at Westview
- Lot 27 Plan at Creekside at Westview
- Lot 3 Plan at Creekside at Westview
- Lot 17 Plan at Creekside at Westview
- Lot 24 Plan at Creekside at Westview
- Lot 23 Plan at Creekside at Westview
- Lot 28 Plan at Creekside at Westview
- Lot 20 Plan at Creekside at Westview
- 4544 NW 166th Ave
- 4592 NW 166th Ave
- 4608 NW 166th Ave
- 4520 NW 166th Ave
- 4603 NW Buckboard Dr
- 4622 NW 166th Ave
- 4617 NW 166th Ave
- 4611 NW Buckboard Dr
- 4636 NW 166th Ave
- 4619 NW Buckboard Dr
- 4641 NW 166th Ave
- 4650 NW 166th Ave
- 4443 NW Glenlakes Place
- 4655 NW 166th Ave
- 4436 NW Glenlakes Place
- 4627 NW Buckboard Dr
- 4664 NW 166th Ave
- 4632 NW Buckboard Dr
- 4490 NW Legend Trail Place
- 4397 NW Palo Verde Place