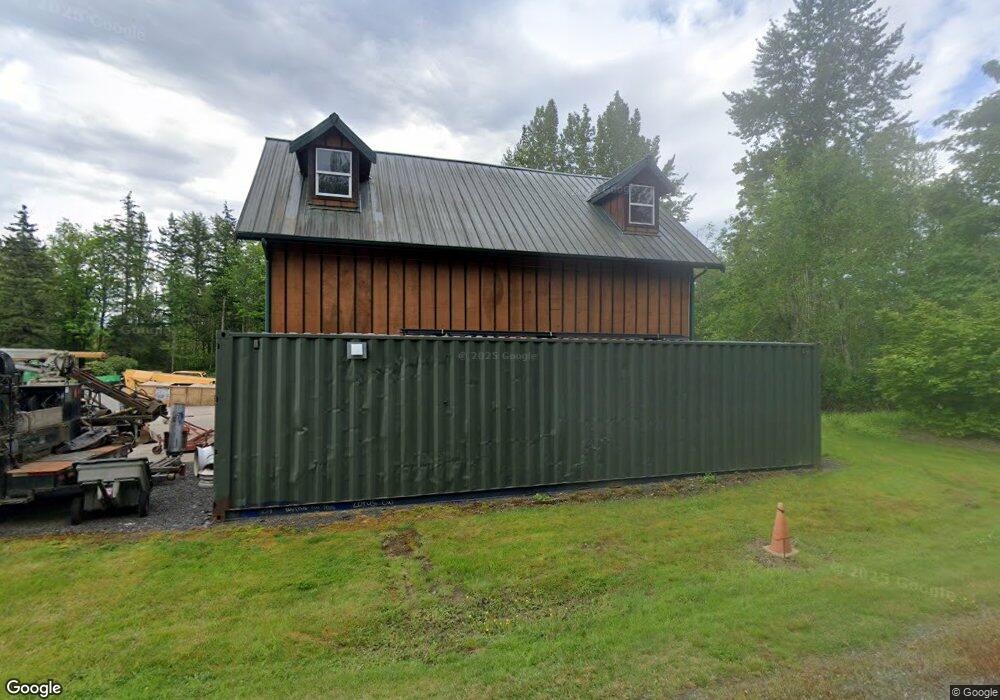
4568 Vining Rd Bellingham, WA 98226
Estimated Value: $1,007,000 - $1,231,000
3
Beds
2
Baths
2,717
Sq Ft
$418/Sq Ft
Est. Value
About This Home
This home is located at 4568 Vining Rd, Bellingham, WA 98226 and is currently estimated at $1,135,270, approximately $417 per square foot. 4568 Vining Rd is a home located in Whatcom County with nearby schools including Northern Heights Elementary School, Shuksan Middle School, and Squalicum High School.
Ownership History
Date
Name
Owned For
Owner Type
Purchase Details
Closed on
Jun 21, 2017
Sold by
Kunzmann Frederick B
Bought by
Kunzmann Frederick B
Current Estimated Value
Purchase Details
Closed on
Jun 8, 2010
Sold by
Mcclary Debora J and Fox Debora J
Bought by
Leblonde James E and Lenaburg Gayle A
Home Financials for this Owner
Home Financials are based on the most recent Mortgage that was taken out on this home.
Original Mortgage
$270,000
Outstanding Balance
$181,487
Interest Rate
5.03%
Mortgage Type
New Conventional
Estimated Equity
$953,783
Purchase Details
Closed on
Jul 14, 2005
Sold by
Warren Todd and Warren Cheryl
Bought by
Fox Debora J
Home Financials for this Owner
Home Financials are based on the most recent Mortgage that was taken out on this home.
Original Mortgage
$472,500
Interest Rate
5.55%
Mortgage Type
Fannie Mae Freddie Mac
Create a Home Valuation Report for This Property
The Home Valuation Report is an in-depth analysis detailing your home's value as well as a comparison with similar homes in the area
Home Values in the Area
Average Home Value in this Area
Purchase History
| Date | Buyer | Sale Price | Title Company |
|---|---|---|---|
| Kunzmann Frederick B | -- | None Available | |
| Leblonde James E | $430,280 | Chicago Title Insurance | |
| Fox Debora J | $525,280 | Whatcom Land Title |
Source: Public Records
Mortgage History
| Date | Status | Borrower | Loan Amount |
|---|---|---|---|
| Open | Leblonde James E | $270,000 | |
| Previous Owner | Fox Debora J | $472,500 |
Source: Public Records
Tax History Compared to Growth
Tax History
| Year | Tax Paid | Tax Assessment Tax Assessment Total Assessment is a certain percentage of the fair market value that is determined by local assessors to be the total taxable value of land and additions on the property. | Land | Improvement |
|---|---|---|---|---|
| 2024 | $9,779 | $1,186,131 | $330,120 | $856,011 |
| 2023 | $9,779 | $1,159,495 | $322,707 | $836,788 |
| 2022 | $7,539 | $912,989 | $254,100 | $658,889 |
| 2021 | $7,057 | $754,536 | $210,000 | $544,536 |
| 2020 | $7,019 | $664,456 | $236,208 | $428,248 |
| 2019 | $6,474 | $632,815 | $224,960 | $407,855 |
| 2018 | $7,002 | $587,807 | $208,960 | $378,847 |
| 2017 | $5,769 | $542,799 | $192,960 | $349,839 |
| 2016 | $5,517 | $466,285 | $165,760 | $300,525 |
| 2015 | $5,639 | $459,750 | $160,000 | $299,750 |
| 2014 | -- | $457,016 | $159,200 | $297,816 |
| 2013 | -- | $460,124 | $160,000 | $300,124 |
Source: Public Records
Map
Nearby Homes
- 4645 Vining Rd
- 0 van Wyck Ln
- 1041 Sterk Ln
- 4269 Dewey Rd
- 1430 Mt Baker Hwy
- 1445 Mt Baker Hwy
- 626 van Wyck Rd
- 3827 Keystone Way
- 2870 E Bakerview Rd
- 0 E Bakerview Rd Unit NWM2398341
- 3817 E Sunset Dr
- 3715 E Sunset Dr
- 4160 Hannegan Rd
- 3606 Tree Farm Ct
- 4220 Brays Way
- 4136 Malachite Dr
- 4121 Malachite Dr
- 4292 King Mountain Rd
- 1368 Roma Rd
- 5180 Penny Ln
- 1156 van Wyck Rd
- 1176 van Wyck Rd
- 1160 van Wyck Rd
- 4572 Vining Rd
- 1152 van Wyck Rd
- 1122 van Wyck Rd
- 1190 van Wyck Rd
- 1148 van Wyck Rd
- 4563 Vining Rd
- 1131 van Wyck Rd
- 1090 van Wyck Rd
- 4575 Vining Rd
- 1093 van Wyck Rd
- 1169 van Wyck Rd
- 4603 Vining Rd
- 1087 van Wyck Rd
- 1194 van Wyck Rd
- 4530 Vacca Ln
- 1123 van Wyck Rd
- 4525 Husky Dr