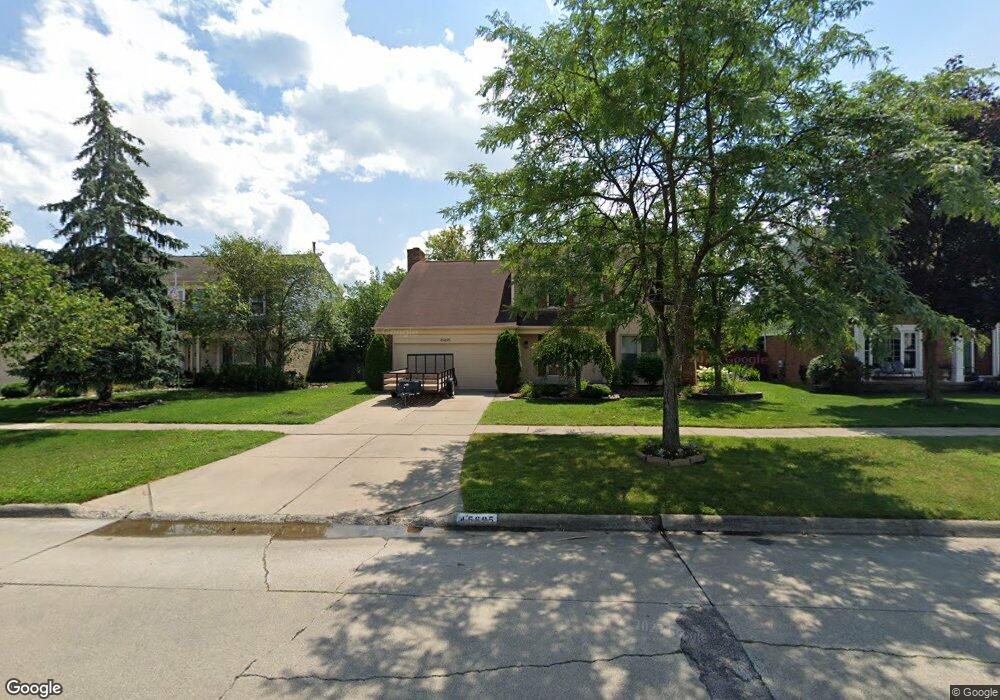
45695 Hanford Rd Unit Bldg-Unit Canton, MI 48187
Sunflower Village NeighborhoodEstimated Value: $474,000 - $547,000
--
Bed
3
Baths
2,024
Sq Ft
$249/Sq Ft
Est. Value
About This Home
This home is located at 45695 Hanford Rd Unit Bldg-Unit, Canton, MI 48187 and is currently estimated at $504,236, approximately $249 per square foot. 45695 Hanford Rd Unit Bldg-Unit is a home located in Wayne County with nearby schools including Canton High School, Plymouth High School, and Salem High School.
Ownership History
Date
Name
Owned For
Owner Type
Purchase Details
Closed on
Jul 6, 2018
Sold by
Roberts Steven M and Roberts Jean M
Bought by
Bobby John and Bobby Joy Michelle
Current Estimated Value
Purchase Details
Closed on
Jan 28, 2016
Sold by
Stone Patricia A
Bought by
Roberts Steven M and Roberts Jean M
Create a Home Valuation Report for This Property
The Home Valuation Report is an in-depth analysis detailing your home's value as well as a comparison with similar homes in the area
Home Values in the Area
Average Home Value in this Area
Purchase History
| Date | Buyer | Sale Price | Title Company |
|---|---|---|---|
| Bobby John | $328,000 | None Available | |
| Roberts Steven M | $264,900 | Title One Inc |
Source: Public Records
Tax History Compared to Growth
Tax History
| Year | Tax Paid | Tax Assessment Tax Assessment Total Assessment is a certain percentage of the fair market value that is determined by local assessors to be the total taxable value of land and additions on the property. | Land | Improvement |
|---|---|---|---|---|
| 2025 | $2,851 | $198,800 | $0 | $0 |
| 2024 | $2,851 | $188,000 | $0 | $0 |
| 2023 | $2,718 | $169,600 | $0 | $0 |
| 2022 | $5,909 | $152,300 | $0 | $0 |
| 2021 | $5,735 | $144,700 | $0 | $0 |
| 2020 | $5,664 | $139,800 | $0 | $0 |
| 2019 | $5,559 | $134,280 | $0 | $0 |
| 2018 | $2,345 | $133,140 | $0 | $0 |
| 2017 | $5,830 | $131,600 | $0 | $0 |
| 2016 | $4,184 | $129,900 | $0 | $0 |
| 2015 | $10,434 | $119,370 | $0 | $0 |
| 2013 | $10,108 | $108,360 | $0 | $0 |
| 2010 | -- | $108,990 | $44,214 | $64,776 |
Source: Public Records
Map
Nearby Homes
- 6844 Woodmere Dr
- 50782 Ross St
- 48590 Ford Rd
- 46555 Maben Rd
- 6750 N Canton Center Rd
- 46500 E Oak Manor Ct
- 0000 Ford
- 45139 Indian Creek Dr
- 45228 Patrick Dr
- 44995 Quaker Hill Dr
- 44665 Hanford Rd
- 44661 Jeffrey Cir
- 46859 Hendrie Ct
- 45900 Gainsborough Dr
- 1525 Peninsula Ct Unit 150
- 1584 Commodore Cir Unit 33
- 6832 New Providence Way Unit 1007
- 45412 Embassy Ct
- 46743 Crosswick
- 6986 Harvard Ln Unit 129
- 45695 Hanford Rd
- 45683 Hanford Rd
- 45707 Hanford Rd
- 45708 Bryn Mawr Rd
- 45696 Bryn Mawr Rd
- 45719 Hanford Rd
- 45671 Hanford Rd
- 45720 Bryn Mawr Rd
- 45684 Bryn Mawr Rd
- 45694 Hanford Rd
- 45732 Bryn Mawr Rd
- 45731 Hanford Rd
- 45659 Hanford Rd
- 45672 Bryn Mawr Rd
- 45706 Hanford Rd
- 45670 Hanford Rd
- 45718 Hanford Rd
- 45658 Hanford Rd
- 45744 Bryn Mawr Rd
- 45743 Hanford Rd