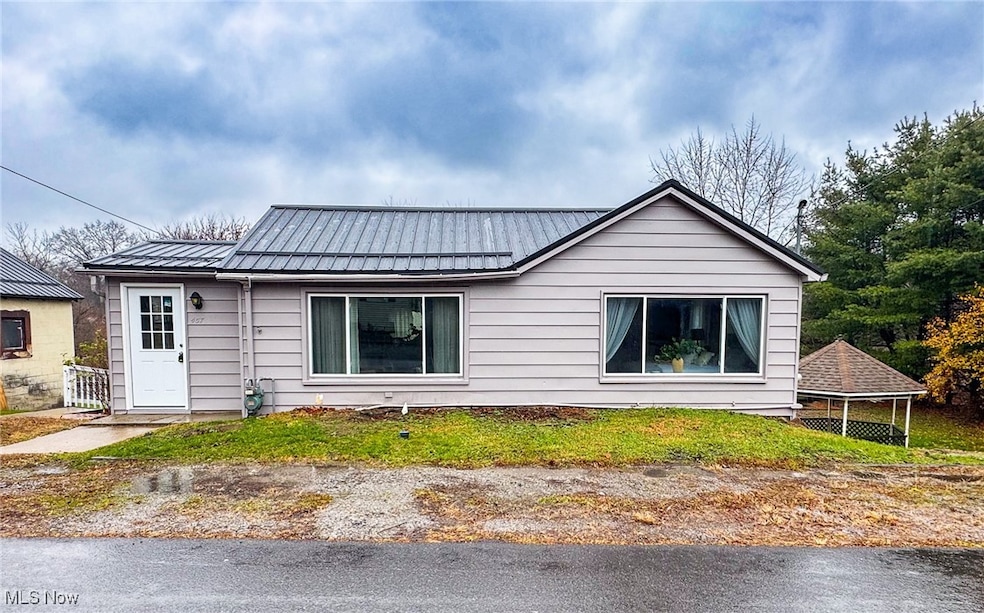
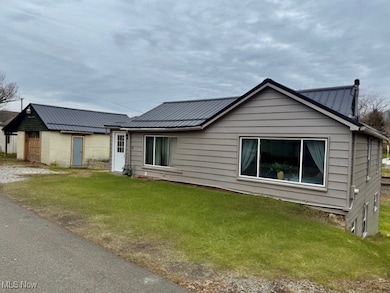
457 Cherry Fork Ave Leetonia, OH 44431
Estimated payment $866/month
Highlights
- No HOA
- Bungalow
- Forced Air Heating and Cooling System
- 2 Car Detached Garage
About This Home
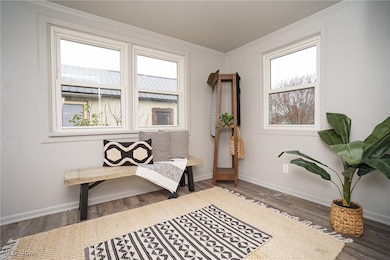
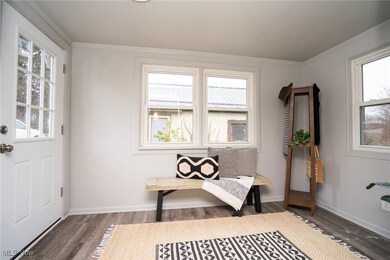
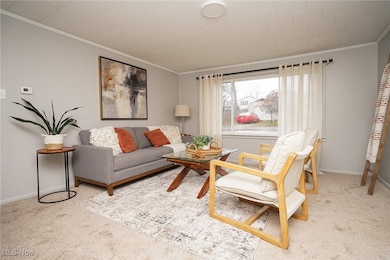
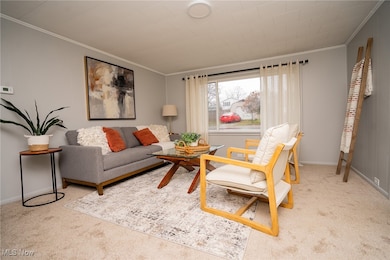
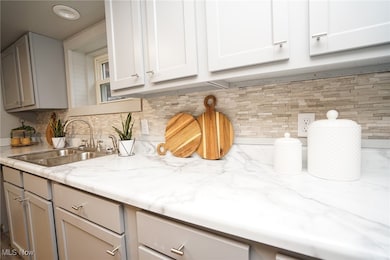
457 Cherry Fork Avenue, Leetonia, OH — “The little big house that lives large!” Beautifully renovated 3-bedroom, 2-full-bath bungalow situated on a spacious .33-acre lot in the heart of Leetonia’s charming small-town setting with convenient access to major routes and the freeway for easy commuting. This updated home delivers far more space than expected with a floor plan offering a generous entry foyer, welcoming living room, eat-in kitchen or dining room option, plus a versatile sitting area ideal for a home office, reading nook, or flex space. The kitchen has been freshly updated and includes a stove and refrigerator. Recent improvements include all-new flooring throughout, fresh interior paint, new metal roof, brand-new central A/C, and updated electrical — providing modern comfort and peace of mind. Outdoor living shines with a detached 17x24 garage currently in the process of receiving new siding, a screened-in back porch, shed, gazebo, and plenty of green space for gardening, outdoor entertaining, or simply enjoying quiet country evenings. Leetonia is known for its proud industrial roots and close-knit community charm, home to the historic Cherry Valley Coke Ovens and scenic countryside, offering a peaceful rural lifestyle with small-town character while remaining within easy reach of Youngstown and surrounding communities. A rare opportunity to enjoy modern updates, flexible living space, and the charm of a true American village — this home truly lives large. #457cherryfork #leetoniaohio #renovatedandready #homehappenshere #bungalow
Listing Agent
Howard Hanna Brokerage Email: clautzenheiser@howardhanna.com, 330-565-3712 License #449022 Listed on: 11/28/2025

Home Details
Home Type
- Single Family
Est. Annual Taxes
- $928
Year Built
- Built in 1947
Lot Details
- 0.33 Acre Lot
- 58-00700.000
Parking
- 2 Car Detached Garage
Home Design
- Bungalow
- Metal Roof
- Vinyl Siding
Interior Spaces
- 2-Story Property
- Basement Fills Entire Space Under The House
Bedrooms and Bathrooms
- 3 Main Level Bedrooms
- 2 Full Bathrooms
Utilities
- Forced Air Heating and Cooling System
- Heating System Uses Gas
Community Details
- No Home Owners Association
- Nolds 03 Subdivision
Listing and Financial Details
- Assessor Parcel Number 5800699000
Map
Home Values in the Area
Average Home Value in this Area
Tax History
| Year | Tax Paid | Tax Assessment Tax Assessment Total Assessment is a certain percentage of the fair market value that is determined by local assessors to be the total taxable value of land and additions on the property. | Land | Improvement |
|---|---|---|---|---|
| 2024 | $791 | $22,200 | $2,910 | $19,290 |
| 2023 | $792 | $22,200 | $2,910 | $19,290 |
| 2022 | $795 | $22,200 | $2,910 | $19,290 |
| 2021 | $653 | $17,370 | $2,910 | $14,460 |
| 2020 | $669 | $17,370 | $2,910 | $14,460 |
| 2019 | $691 | $17,370 | $2,910 | $14,460 |
| 2018 | $662 | $15,760 | $2,630 | $13,130 |
| 2017 | $660 | $15,760 | $2,630 | $13,130 |
| 2016 | $637 | $15,340 | $3,540 | $11,800 |
| 2015 | $637 | $15,340 | $3,540 | $11,800 |
| 2014 | $629 | $15,340 | $3,540 | $11,800 |
Property History
| Date | Event | Price | List to Sale | Price per Sq Ft |
|---|---|---|---|---|
| 11/28/2025 11/28/25 | For Sale | $149,900 | -- | -- |
Purchase History
| Date | Type | Sale Price | Title Company |
|---|---|---|---|
| Quit Claim Deed | $70,700 | None Listed On Document | |
| Quit Claim Deed | $70,700 | None Listed On Document | |
| No Value Available | -- | -- | |
| Warranty Deed | $57,000 | -- | |
| Warranty Deed | $53,900 | Midland Title |
Mortgage History
| Date | Status | Loan Amount | Loan Type |
|---|---|---|---|
| Previous Owner | $54,150 | Purchase Money Mortgage | |
| Previous Owner | $51,205 | No Value Available | |
| Closed | $3,926 | No Value Available |
Source: MLS Now (Howard Hanna)
MLS Number: 5174200
APN: 5800699000
Disclaimer: Certain information contained herein is derived from information provided by parties other than Homes.com. All information provided is deemed reliable, but is not guaranteed to be accurate and should be independently verified.
![]() Certain information contained herein is derived from information provided by parties other than Homes.com. All information provided is deemed reliable, but is not guaranteed to be accurate and should be independently verified.
Certain information contained herein is derived from information provided by parties other than Homes.com. All information provided is deemed reliable, but is not guaranteed to be accurate and should be independently verified.
- 489 Columbia St
- 375 Pearl St
- 262 Walnut St
- 406 Orchard Hill Dr
- 405 Orchard Dr
- 38875 Old State Route 344
- 38495 Old State Route 344
- 200 E Main St
- 275 Walnut St
- 1229 Columbiana Lisbon Rd Unit 46
- 39144 State Route 558
- 3600 Leetonia Rd
- 955 W Main St
- 909 Lisbon Rd
- 3753 Grafton Rd
- 366 Lisbon St
- 110 N Cross St
- 126 S West St
- 2396 Camelot Dr
- 135 N Middle St
- 1-42 Jenny Ln
- 1600-1661 Fairview Ct
- 13096 Beaver Creek Rd Unit 1
- 1182 S Lincoln Ave Unit A
- 493 Washington St
- 968 E 3rd St Unit 3
- 123 S Lincoln Ave
- 252 E 3rd St
- 157 W 7th St
- 12642 Sharon Lynn Dr Unit 1-12640
- 66 Carter Cir Unit 4
- 8421 Colwyn Ct Unit 3
- 9 Kreidler Rd
- 66 Washington Blvd Unit 5
- 8250 Southern Blvd
- 8260 Southern Blvd
- 9 Maple St Unit 9 Maple St
- 7 Maple St
- 7956 Market St
- 9190 Springfield Rd