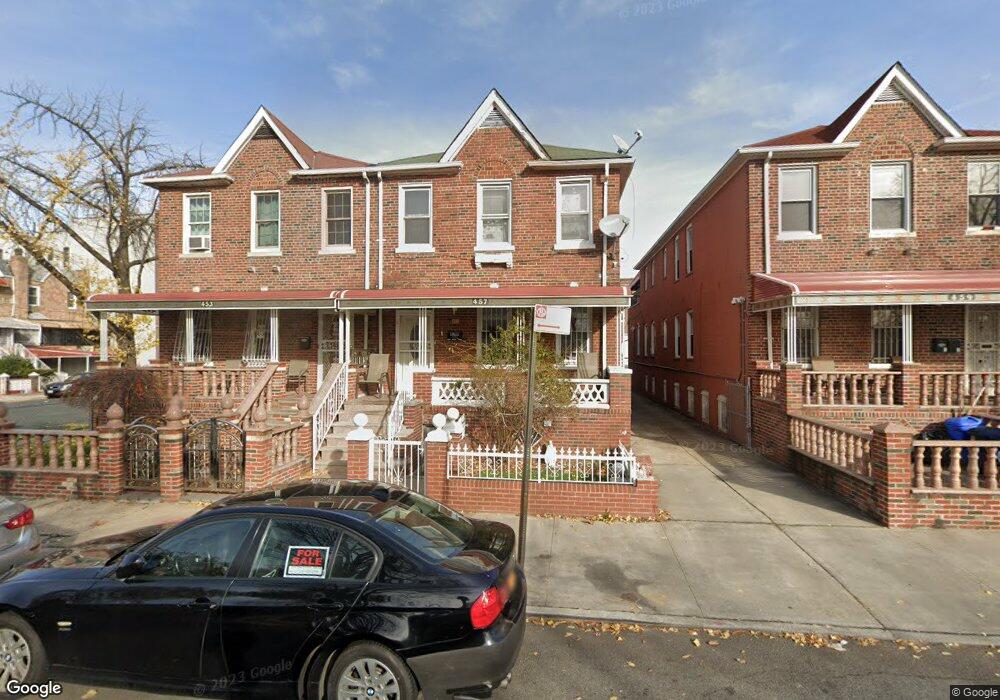
457 E 91st St Brooklyn, NY 11212
East Flatbush NeighborhoodEstimated Value: $921,000 - $1,009,000
Studio
--
Bath
2,410
Sq Ft
$405/Sq Ft
Est. Value
About This Home
This home is located at 457 E 91st St, Brooklyn, NY 11212 and is currently estimated at $976,333, approximately $405 per square foot. 457 E 91st St is a home located in Kings County with nearby schools including P.S. 219 Kennedy King, Middle School For Art And Philosphy, and Kings Elementary School.
Ownership History
Date
Name
Owned For
Owner Type
Purchase Details
Closed on
Mar 25, 2021
Sold by
Hosten-Peters Kathy and Peters Anthony M
Bought by
Hosten-Peters Kathy Ann and Peters Anthony M
Current Estimated Value
Home Financials for this Owner
Home Financials are based on the most recent Mortgage that was taken out on this home.
Original Mortgage
$221,011
Outstanding Balance
$201,100
Interest Rate
3.76%
Mortgage Type
Purchase Money Mortgage
Estimated Equity
$775,233
Purchase Details
Closed on
Jul 27, 2015
Sold by
Hosten Kathy A and Peters Anthony
Bought by
Hosten-Peters Kathy and Peters Anthony M
Purchase Details
Closed on
Nov 16, 1999
Sold by
Scanlon Frances E Ref and Ramsay Delsa Def
Bought by
Secretary Of Housing & U
Purchase Details
Closed on
Sep 5, 1995
Sold by
Hewitt David and Hewitt Beverly T
Bought by
Ramsay Delsa
Home Financials for this Owner
Home Financials are based on the most recent Mortgage that was taken out on this home.
Original Mortgage
$199,150
Interest Rate
7.89%
Mortgage Type
FHA
Create a Home Valuation Report for This Property
The Home Valuation Report is an in-depth analysis detailing your home's value as well as a comparison with similar homes in the area
Home Values in the Area
Average Home Value in this Area
Purchase History
| Date | Buyer | Sale Price | Title Company |
|---|---|---|---|
| Hosten-Peters Kathy Ann | -- | -- | |
| Hosten-Peters Kathy Ann | -- | -- | |
| Hosten-Peters Kathy Ann | -- | -- | |
| Hosten-Peters Kathy | -- | -- | |
| Hosten-Peters Kathy | -- | -- | |
| Hosten-Peters Kathy | -- | -- | |
| Secretary Of Housing & U | -- | -- | |
| Secretary Of Housing & U | -- | -- | |
| Ramsay Delsa | $200,000 | -- | |
| Ramsay Delsa | $200,000 | -- |
Source: Public Records
Mortgage History
| Date | Status | Borrower | Loan Amount |
|---|---|---|---|
| Open | Hosten-Peters Kathy Ann | $221,011 | |
| Closed | Hosten-Peters Kathy Ann | $221,011 | |
| Previous Owner | Ramsay Delsa | $199,150 |
Source: Public Records
Tax History
| Year | Tax Paid | Tax Assessment Tax Assessment Total Assessment is a certain percentage of the fair market value that is determined by local assessors to be the total taxable value of land and additions on the property. | Land | Improvement |
|---|---|---|---|---|
| 2025 | $5,947 | $53,460 | $22,260 | $31,200 |
| 2024 | $5,947 | $52,320 | $22,260 | $30,060 |
| 2023 | $5,602 | $51,360 | $22,260 | $29,100 |
| 2022 | $5,153 | $42,060 | $22,260 | $19,800 |
| 2021 | $4,093 | $32,460 | $22,260 | $10,200 |
| 2019 | $4,945 | $40,380 | $22,260 | $18,120 |
| 2018 | $4,463 | $28,152 | $18,453 | $9,699 |
| 2017 | $4,576 | $26,707 | $17,599 | $9,108 |
| 2016 | $4,465 | $26,707 | $17,662 | $9,045 |
| 2015 | $2,543 | $26,359 | $15,815 | $10,544 |
| 2014 | $2,543 | $24,867 | $16,383 | $8,484 |
Source: Public Records
Map
Nearby Homes
- 1040 Willmohr St
- 980 Lenox Rd
- 487 E 93rd St
- 448 E 94th St
- 455 E 94th St
- 336 E 91st St Unit 4
- 891 Linden Blvd
- 563 E 91st St
- 445 E 95th St
- 323 E 91st St
- 27 E 56th St
- 890 Linden Blvd
- 1108 Willmohr St
- 886 Linden Blvd Unit 888
- 1110 Willmohr St
- 871 Linden Blvd
- 370 E 96th St
- 5749 Kings Hwy
- 315 E 94th St
- 175 E 55th St
- 453 E 91st St
- 459 E 91st St
- 461 E 91st St
- 465 E 91st St
- 452 E 92nd St
- 450 E 92nd St
- 456 E 92nd St
- 1011 Linden Blvd
- 458 E 92nd St
- 460 E 92nd St
- 462 E 92nd St
- 1015 Linden Blvd
- 462 E 92 St
- 991 Willmohr St
- 991 Willmohr St Unit 2
- 991 Willmohr St Unit 1
- 466 E 92nd St
- 466 E 92nd St Unit 1
- 999 Willmohr St Unit 1st and 2nd floor
- 999 Willmohr St Unit Walk In-Downstairs
Your Personal Tour Guide
Ask me questions while you tour the home.