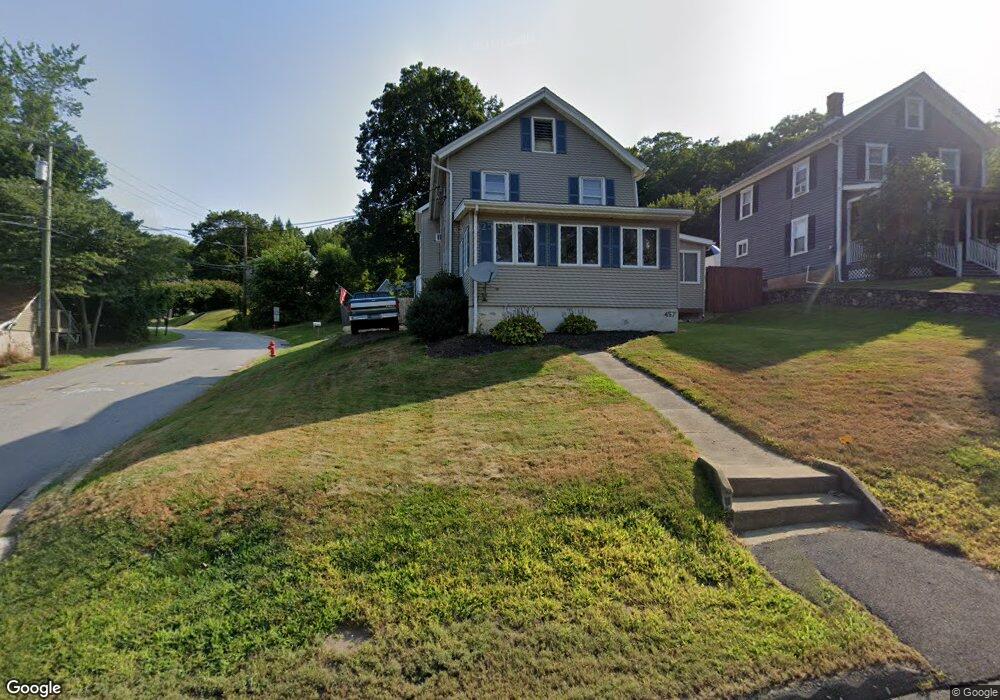
457 E Main St Thomaston, CT 06787
Estimated Value: $290,702 - $493,000
3
Beds
2
Baths
2,213
Sq Ft
$167/Sq Ft
Est. Value
About This Home
This home is located at 457 E Main St, Thomaston, CT 06787 and is currently estimated at $370,426, approximately $167 per square foot. 457 E Main St is a home located in Litchfield County with nearby schools including Black Rock School, Thomaston Center School, and Thomaston High School.
Ownership History
Date
Name
Owned For
Owner Type
Purchase Details
Closed on
Aug 26, 2002
Sold by
Burker Matthew
Bought by
Thomas John and Thomas Donna
Current Estimated Value
Home Financials for this Owner
Home Financials are based on the most recent Mortgage that was taken out on this home.
Original Mortgage
$143,900
Interest Rate
6.57%
Purchase Details
Closed on
Jun 3, 1998
Sold by
Wenzloff Lawrence and Wenzloff Betty Jean
Bought by
Ross Robert and Ross Kelly
Create a Home Valuation Report for This Property
The Home Valuation Report is an in-depth analysis detailing your home's value as well as a comparison with similar homes in the area
Home Values in the Area
Average Home Value in this Area
Purchase History
| Date | Buyer | Sale Price | Title Company |
|---|---|---|---|
| Thomas John | $159,900 | -- | |
| Ross Robert | $115,000 | -- |
Source: Public Records
Mortgage History
| Date | Status | Borrower | Loan Amount |
|---|---|---|---|
| Open | Ross Robert | $143,000 | |
| Closed | Ross Robert | $29,795 | |
| Closed | Ross Robert | $160,000 | |
| Closed | Ross Robert | $143,900 |
Source: Public Records
Tax History
| Year | Tax Paid | Tax Assessment Tax Assessment Total Assessment is a certain percentage of the fair market value that is determined by local assessors to be the total taxable value of land and additions on the property. | Land | Improvement |
|---|---|---|---|---|
| 2025 | $4,998 | $139,580 | $40,180 | $99,400 |
| 2024 | $4,796 | $139,580 | $40,180 | $99,400 |
| 2023 | $4,694 | $139,580 | $40,180 | $99,400 |
| 2022 | $4,482 | $139,580 | $40,180 | $99,400 |
| 2021 | $3,920 | $108,500 | $40,180 | $68,320 |
| 2020 | $3,920 | $108,500 | $40,180 | $68,320 |
| 2019 | $3,964 | $108,500 | $40,180 | $68,320 |
| 2018 | $3,883 | $108,500 | $40,180 | $68,320 |
| 2017 | $3,803 | $108,500 | $40,180 | $68,320 |
| 2016 | $3,883 | $113,960 | $38,290 | $75,670 |
| 2015 | $3,832 | $113,960 | $38,290 | $75,670 |
| 2014 | $3,832 | $113,960 | $38,290 | $75,670 |
Source: Public Records
Map
Nearby Homes
- 785 Main St
- 56 Hillside Ave
- 7 South St
- 22 Park St
- 713 Pine Hill Blvd
- 211 Pine Hill Blvd Unit 211
- 102 Elm St
- 41 South St
- 16 Grand St
- 58 Litchfield St
- 120 Hotchkiss Ave
- 23 Keegan Rd
- 123 Todd Hollow Rd
- 63 Ridge Rd
- 37 Steven's Blvd Unit 49
- 15 Scott Rd
- 3 Ellen Ln
- 143 Pine Hill Rd Unit 17A
- 143 Pine Hill Rd Unit 15F
- 409 Main St
Your Personal Tour Guide
Ask me questions while you tour the home.