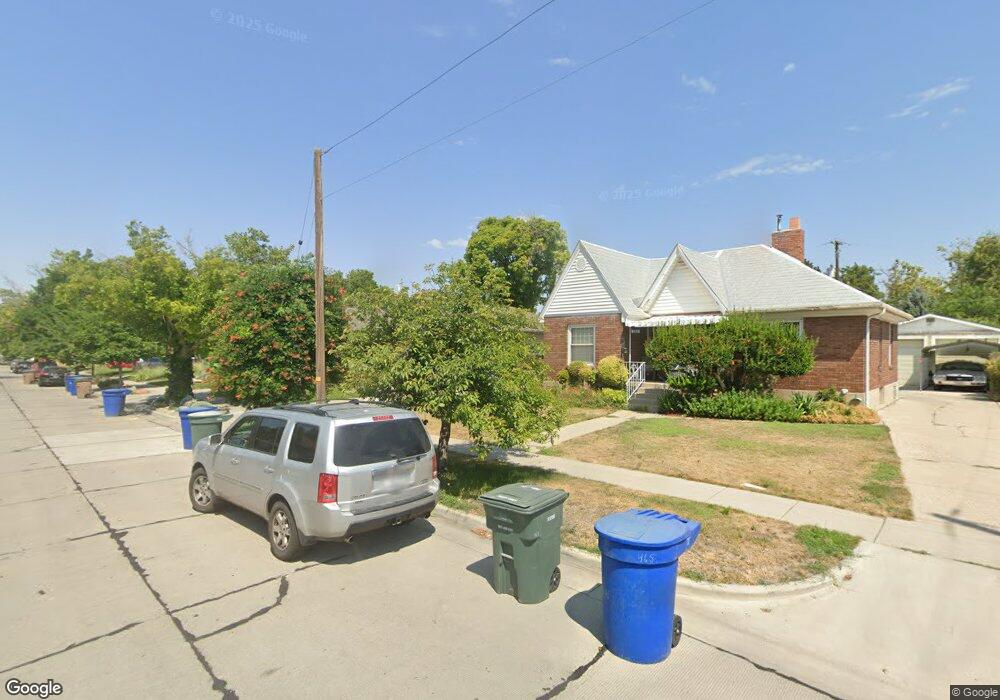
457 Edith Ave Salt Lake City, UT 84111
Liberty Wells NeighborhoodEstimated Value: $566,000 - $611,000
2
Beds
1
Bath
1,190
Sq Ft
$492/Sq Ft
Est. Value
About This Home
This home is located at 457 Edith Ave, Salt Lake City, UT 84111 and is currently estimated at $585,972, approximately $492 per square foot. 457 Edith Ave is a home located in Salt Lake County with nearby schools including Liberty Elementary School, Clayton Middle School, and Highland High School.
Ownership History
Date
Name
Owned For
Owner Type
Purchase Details
Closed on
Jul 15, 2013
Sold by
Talbot Michael J and Glenn Jimmy J
Bought by
Glenn Jimmy J and Talbot Michael J
Current Estimated Value
Purchase Details
Closed on
Nov 27, 2002
Sold by
Glenn Jim and Tabot Michael J
Bought by
Talbot Michael J and Glenn Jimmy J
Home Financials for this Owner
Home Financials are based on the most recent Mortgage that was taken out on this home.
Original Mortgage
$120,000
Interest Rate
5.52%
Purchase Details
Closed on
Oct 23, 1997
Sold by
Coombs Peter B
Bought by
Glenn Jim and Talbot Michael J
Home Financials for this Owner
Home Financials are based on the most recent Mortgage that was taken out on this home.
Original Mortgage
$133,180
Interest Rate
7.49%
Mortgage Type
FHA
Purchase Details
Closed on
Mar 19, 1996
Sold by
Coombs Peter B
Bought by
Coombs Peter B
Home Financials for this Owner
Home Financials are based on the most recent Mortgage that was taken out on this home.
Original Mortgage
$64,500
Interest Rate
6.98%
Create a Home Valuation Report for This Property
The Home Valuation Report is an in-depth analysis detailing your home's value as well as a comparison with similar homes in the area
Home Values in the Area
Average Home Value in this Area
Purchase History
| Date | Buyer | Sale Price | Title Company |
|---|---|---|---|
| Glenn Jimmy J | -- | None Available | |
| Talbot Michael J | -- | Inwest Title Services | |
| Glenn Jim | -- | Paramount Title Corp | |
| Coombs Peter B | -- | -- |
Source: Public Records
Mortgage History
| Date | Status | Borrower | Loan Amount |
|---|---|---|---|
| Closed | Talbot Michael J | $120,000 | |
| Closed | Glenn Jim | $133,180 | |
| Previous Owner | Coombs Peter B | $64,500 |
Source: Public Records
Tax History Compared to Growth
Tax History
| Year | Tax Paid | Tax Assessment Tax Assessment Total Assessment is a certain percentage of the fair market value that is determined by local assessors to be the total taxable value of land and additions on the property. | Land | Improvement |
|---|---|---|---|---|
| 2025 | $2,749 | $548,700 | $229,100 | $319,600 |
| 2024 | $2,749 | $524,500 | $216,700 | $307,800 |
| 2023 | $2,781 | $511,500 | $208,400 | $303,100 |
| 2022 | $2,647 | $456,800 | $204,300 | $252,500 |
| 2021 | $2,348 | $366,900 | $163,400 | $203,500 |
| 2020 | $2,268 | $337,300 | $136,200 | $201,100 |
| 2019 | $2,214 | $309,800 | $128,000 | $181,800 |
| 2018 | $2,129 | $290,100 | $128,000 | $162,100 |
| 2017 | $1,987 | $253,600 | $128,000 | $125,600 |
| 2016 | $2,031 | $246,200 | $84,400 | $161,800 |
| 2015 | $1,941 | $223,000 | $82,800 | $140,200 |
| 2014 | -- | $213,500 | $81,100 | $132,400 |
Source: Public Records
Map
Nearby Homes
- 1240 S 400 E
- 1211 Liberty Wells Place
- 1067 S 400 E
- 1196 Liberty Wells Place
- 1051 Denver St
- 331 Hampton Ave S
- 328 Hampton Ave S
- 1349 S 500 E
- 1175 S 300 E
- 432 E Harrison Ave
- 356 E Williams Ave
- 1326 S Green St
- 1336 S Green St
- 1019 S 300 E
- 1401 S 300 E
- 557 E Cleveland Ave
- 217 E 1300 S
- 182 E Kelsey Ave
- 182 Edith Ave S
- 1332 S 200 E