Estimated Value: $54,841 - $199,000
--
Bed
1
Bath
926
Sq Ft
$163/Sq Ft
Est. Value
About This Home
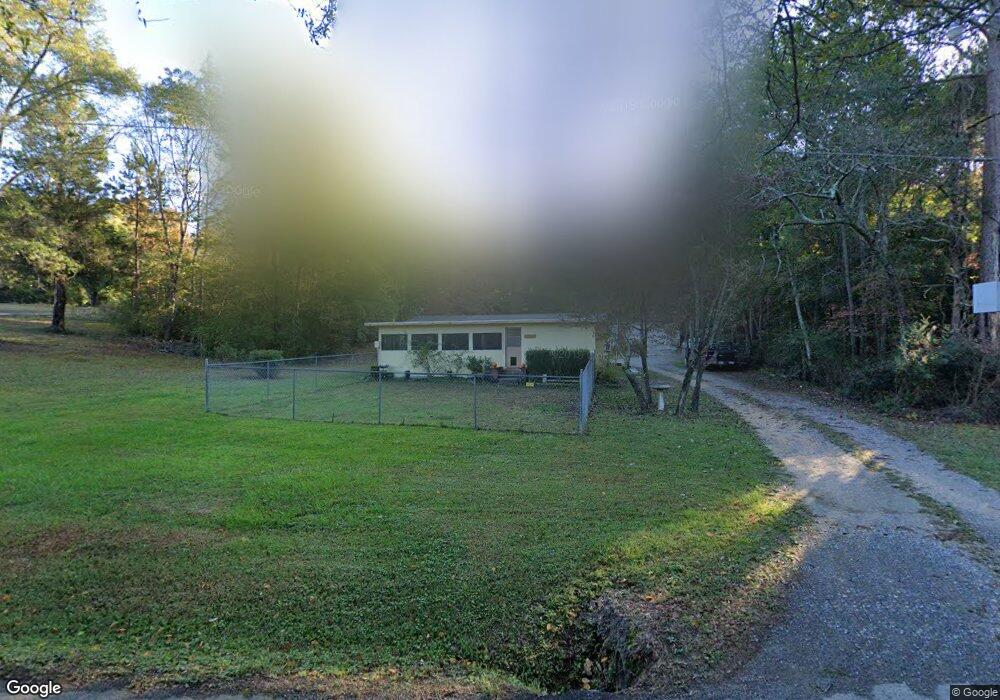
This home is located at 457 Freeman Ferry Rd SE, Rome, GA 30161 and is currently estimated at $150,960, approximately $163 per square foot. 457 Freeman Ferry Rd SE is a home located in Floyd County with nearby schools including Model Middle School, Model High School, and Unity Christian School.
Ownership History
Date
Name
Owned For
Owner Type
Purchase Details
Closed on
Dec 14, 2020
Sold by
Sears Loise Ardina
Bought by
Sandy Bridget N
Current Estimated Value
Purchase Details
Closed on
Apr 22, 2016
Sold by
Sears Marsha
Bought by
Sears James R
Purchase Details
Closed on
Mar 15, 2016
Sold by
Sears James R
Bought by
Sears Marsha
Purchase Details
Closed on
Jul 31, 2015
Sold by
Sears Marsha
Bought by
Sears James R and Sears Dana A
Purchase Details
Closed on
Aug 28, 1998
Bought by
P and R
Purchase Details
Closed on
Sep 3, 1997
Sold by
Haynie
Bought by
Haynie Ralph N
Purchase Details
Closed on
Nov 29, 1996
Sold by
Haynie Betty D and Haynie Ralph N
Bought by
Haynie
Purchase Details
Closed on
Nov 26, 1996
Sold by
Payne L A
Bought by
Haynie Betty D and Haynie Ralph N
Purchase Details
Closed on
Jan 1, 1966
Bought by
P and R
Purchase Details
Closed on
Jan 1, 1935
Bought by
Payne L A
Create a Home Valuation Report for This Property
The Home Valuation Report is an in-depth analysis detailing your home's value as well as a comparison with similar homes in the area
Home Values in the Area
Average Home Value in this Area
Purchase History
| Date | Buyer | Sale Price | Title Company |
|---|---|---|---|
| Sandy Bridget N | -- | -- | |
| Sears James R | -- | -- | |
| Sears Marsha | -- | -- | |
| Sears James R | -- | -- | |
| Jarrett Lois Sears | -- | -- | |
| Sears Marsha | -- | -- | |
| P | -- | -- | |
| Haynie Ralph N | -- | -- | |
| Haynie | -- | -- | |
| Haynie Betty D | -- | -- | |
| P | $5,000 | -- | |
| Payne L A | -- | -- |
Source: Public Records
Tax History
| Year | Tax Paid | Tax Assessment Tax Assessment Total Assessment is a certain percentage of the fair market value that is determined by local assessors to be the total taxable value of land and additions on the property. | Land | Improvement |
|---|---|---|---|---|
| 2025 | $1,564 | $54,594 | $14,578 | $40,016 |
| 2024 | $1,564 | $49,674 | $12,958 | $36,716 |
| 2023 | $1,421 | $42,858 | $11,780 | $31,078 |
| 2022 | $1,010 | $34,052 | $9,796 | $24,256 |
| 2021 | $805 | $26,680 | $8,934 | $17,746 |
| 2020 | $717 | $23,551 | $8,320 | $15,231 |
| 2019 | $682 | $22,709 | $8,320 | $14,389 |
| 2018 | $646 | $21,471 | $7,924 | $13,547 |
| 2017 | $614 | $20,368 | $7,337 | $13,031 |
| 2016 | $611 | $20,018 | $7,320 | $12,698 |
| 2015 | -- | $21,658 | $8,960 | $12,698 |
| 2014 | -- | $21,658 | $8,960 | $12,698 |
Source: Public Records
Map
Nearby Homes
- 627 Freeman Ferry Rd SE
- 71 Freeman Ferry Rd SE
- 94 Tate Estates Rd SE
- 4 Bridgeview Dr SE
- 45 Wildflower Rd NE
- 0 Moran Lake Rd NE Unit 7676870
- 0 Moran Lake Rd NE Unit 10637931
- 0 Moran Lake Rd NE Unit 10592848
- 0 Moran Lake Rd NE Unit 7639960
- 1 Outpost Trail SE
- 16 Fallen Branch Cir SE
- 69 Fallen Branch Cir SE
- 0 Fallen Branch Cir SE Unit 10311756
- 0 Fallen Branch Cir SE Unit 7732055
- 0 Fallen Branch Cir SE Unit 10172755
- 0 Fallen Branch Cir SE Unit 7234792
- 30 Covey Rise Dr SE
- 11 Breckenridge Rd SE
- 4 Covey Rise Dr SE
- 8 Covey Rise Dr SE
- 489 Freeman Ferry Rd SE
- 537 Freeman Ferry Rd SE
- 429 Freeman Ferry Rd SE
- 520 Freeman Ferry Rd SE
- 559 Freeman Ferry Rd SE
- 550 Freeman Ferry Rd SE
- 550 Freeman Ferry Rd SE
- 357 Freeman Ferry Rd SE
- 623 Freeman Ferry Rd SE
- 343 Freeman Ferry Rd SE
- 570 Freeman Ferry Rd SE
- 570 Freeman Ferry Rd SE
- 321 Freeman Ferry Rd SE
- 326 New Freeman Ferry Rd
- 326 Freeman Ferry Rd SE
- 639 Freeman Ferry Rd SE
- 632 Freeman Ferry Rd SE
- 304 Freeman Ferry Rd SE
- 304 Freeman Ferry Rd SE
- 291 Freeman Ferry Rd SE
Your Personal Tour Guide
Ask me questions while you tour the home.