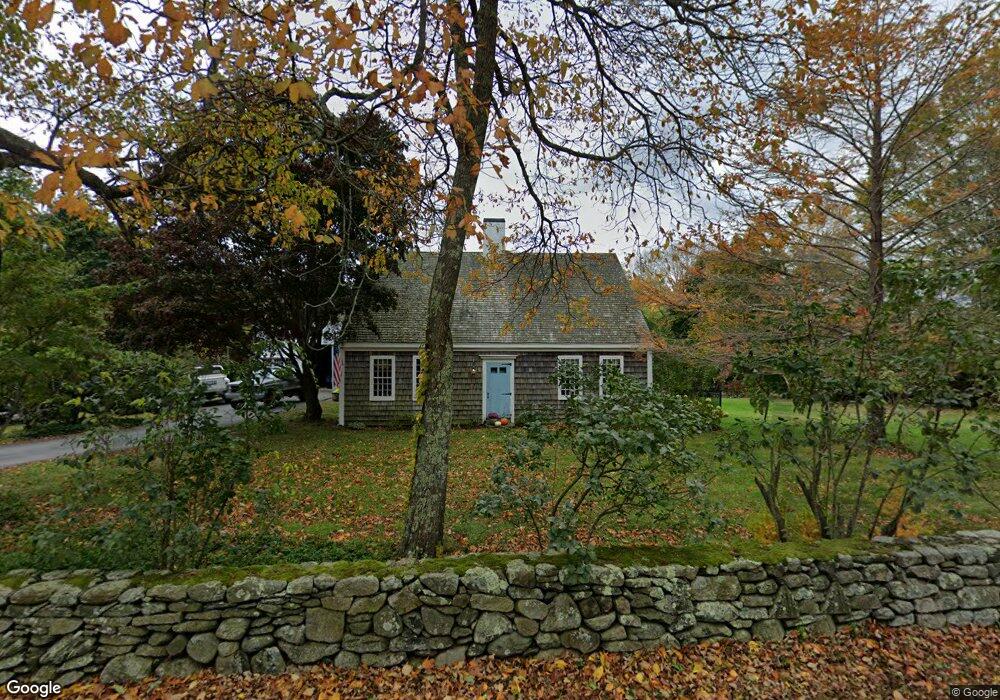
457 High St Hanson, MA 02341
Estimated Value: $662,000 - $1,884,000
3
Beds
3
Baths
3,297
Sq Ft
$315/Sq Ft
Est. Value
About This Home
This home is located at 457 High St, Hanson, MA 02341 and is currently estimated at $1,037,820, approximately $314 per square foot. 457 High St is a home located in Plymouth County.
Ownership History
Date
Name
Owned For
Owner Type
Purchase Details
Closed on
Jun 21, 1993
Sold by
A New Beginning Rt and Madden Tr Ann L
Bought by
Clegg Christine S and Clegg William C
Current Estimated Value
Home Financials for this Owner
Home Financials are based on the most recent Mortgage that was taken out on this home.
Original Mortgage
$128,000
Interest Rate
7.38%
Mortgage Type
Purchase Money Mortgage
Purchase Details
Closed on
Jun 30, 1989
Sold by
Jensen Kenneth E
Bought by
A New Beginning Rt
Create a Home Valuation Report for This Property
The Home Valuation Report is an in-depth analysis detailing your home's value as well as a comparison with similar homes in the area
Home Values in the Area
Average Home Value in this Area
Purchase History
| Date | Buyer | Sale Price | Title Company |
|---|---|---|---|
| Clegg Christine S | $160,000 | -- | |
| A New Beginning Rt | $310,000 | -- |
Source: Public Records
Mortgage History
| Date | Status | Borrower | Loan Amount |
|---|---|---|---|
| Open | A New Beginning Rt | $50,000 | |
| Open | A New Beginning Rt | $150,500 | |
| Closed | A New Beginning Rt | $50,000 | |
| Closed | A New Beginning Rt | $128,000 |
Source: Public Records
Tax History
| Year | Tax Paid | Tax Assessment Tax Assessment Total Assessment is a certain percentage of the fair market value that is determined by local assessors to be the total taxable value of land and additions on the property. | Land | Improvement |
|---|---|---|---|---|
| 2025 | $7,462 | $557,700 | $194,700 | $363,000 |
| 2024 | $7,351 | $549,400 | $189,100 | $360,300 |
| 2023 | $7,237 | $510,400 | $189,100 | $321,300 |
| 2022 | $7,097 | $470,300 | $171,800 | $298,500 |
| 2021 | $6,559 | $434,400 | $165,300 | $269,100 |
| 2020 | $6,494 | $425,300 | $159,700 | $265,600 |
| 2019 | $6,269 | $403,700 | $156,600 | $247,100 |
| 2018 | $6,224 | $393,200 | $150,600 | $242,600 |
| 2017 | $6,061 | $379,300 | $143,400 | $235,900 |
| 2016 | $6,178 | $373,300 | $143,400 | $229,900 |
| 2015 | $5,874 | $369,000 | $143,400 | $225,600 |
Source: Public Records
Map
Nearby Homes
- 80 Phillips St
- 72 Phillips St
- Lot 6 Way
- Lot 2 Harvard Rd
- 361A County Rd
- 361 County Rd
- 1054 Main St
- 61 Sawmill Ln
- 61 Sawmill Ln Unit 61
- 161 Winter St Unit 11
- 84 Liberty St
- Lot 5 Princeton Way
- 26 Franklin St
- 126-130 Franklin St
- 127 Crescent Place
- 134 Crescent St
- 1754 Central St
- 170 Elm St
- 724 Whitman St
- 269 Lakeside Rd
Your Personal Tour Guide
Ask me questions while you tour the home.