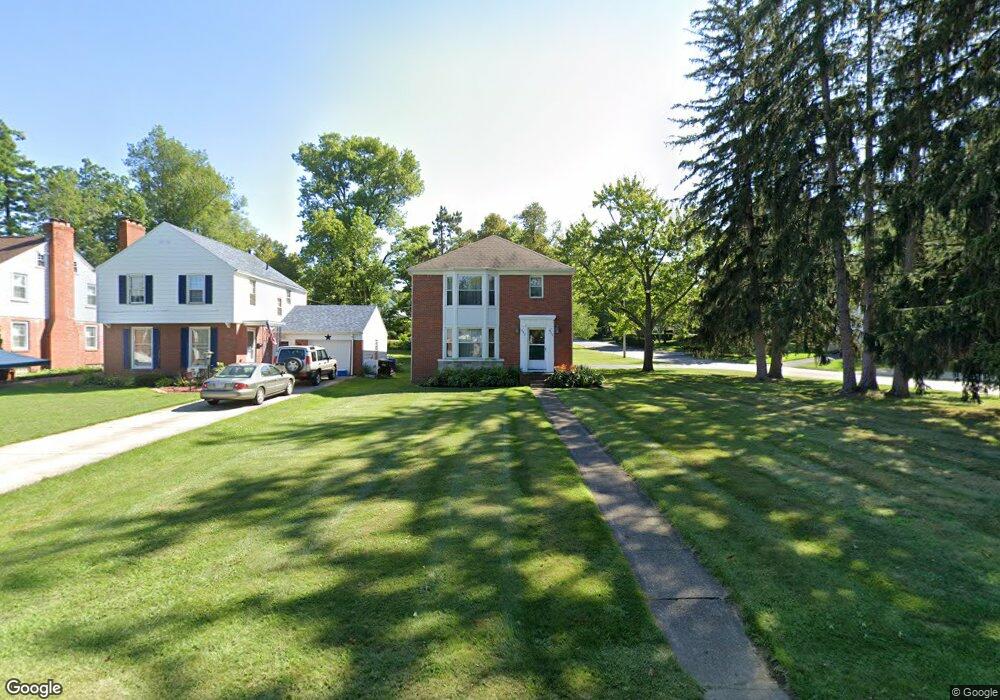
457 Overlook Rd Unit 459 Mansfield, OH 44907
Estimated Value: $206,000 - $297,066
5
Beds
3
Baths
2,950
Sq Ft
$83/Sq Ft
Est. Value
About This Home
This home is located at 457 Overlook Rd Unit 459, Mansfield, OH 44907 and is currently estimated at $244,017, approximately $82 per square foot. 457 Overlook Rd Unit 459 is a home located in Richland County with nearby schools including Discovery School, St. Peter's Elementary/Montessori School, and St. Peter's High School/Junior High.
Ownership History
Date
Name
Owned For
Owner Type
Purchase Details
Closed on
Nov 1, 2017
Sold by
Trinity Villas Real Estate Llc
Bought by
Ohio Heartland Rentals Llc
Current Estimated Value
Purchase Details
Closed on
Sep 12, 2013
Sold by
Smeltz Clayton P
Bought by
Trinity Villas Real Estate Llc
Purchase Details
Closed on
Nov 23, 2005
Sold by
Nemeth Frank and Nemeth Kimberley S
Bought by
Smetlz Clayton P
Home Financials for this Owner
Home Financials are based on the most recent Mortgage that was taken out on this home.
Original Mortgage
$142,200
Interest Rate
5.95%
Mortgage Type
Fannie Mae Freddie Mac
Purchase Details
Closed on
Mar 27, 1998
Sold by
Hock Larry G
Bought by
Nemeth Frank Kimberley S
Home Financials for this Owner
Home Financials are based on the most recent Mortgage that was taken out on this home.
Original Mortgage
$128,250
Interest Rate
6.5%
Mortgage Type
New Conventional
Create a Home Valuation Report for This Property
The Home Valuation Report is an in-depth analysis detailing your home's value as well as a comparison with similar homes in the area
Home Values in the Area
Average Home Value in this Area
Purchase History
| Date | Buyer | Sale Price | Title Company |
|---|---|---|---|
| Ohio Heartland Rentals Llc | -- | Barrister Title | |
| Trinity Villas Real Estate Llc | -- | Attorney | |
| Smetlz Clayton P | $158,000 | Chicago Title | |
| Nemeth Frank Kimberley S | $142,500 | -- |
Source: Public Records
Mortgage History
| Date | Status | Borrower | Loan Amount |
|---|---|---|---|
| Previous Owner | Smetlz Clayton P | $142,200 | |
| Previous Owner | Nemeth Frank Kimberley S | $128,250 |
Source: Public Records
Tax History Compared to Growth
Tax History
| Year | Tax Paid | Tax Assessment Tax Assessment Total Assessment is a certain percentage of the fair market value that is determined by local assessors to be the total taxable value of land and additions on the property. | Land | Improvement |
|---|---|---|---|---|
| 2024 | $3,917 | $81,810 | $8,490 | $73,320 |
| 2023 | $3,917 | $81,810 | $8,490 | $73,320 |
| 2022 | $3,485 | $61,010 | $7,590 | $53,420 |
| 2021 | $3,510 | $61,010 | $7,590 | $53,420 |
| 2020 | $3,589 | $61,010 | $7,590 | $53,420 |
| 2019 | $3,372 | $51,710 | $6,430 | $45,280 |
| 2018 | $3,327 | $51,710 | $6,430 | $45,280 |
| 2017 | $3,238 | $51,710 | $6,430 | $45,280 |
| 2016 | $3,261 | $50,500 | $6,240 | $44,260 |
| 2015 | $147 | $50,500 | $6,240 | $44,260 |
| 2014 | $1,214 | $50,500 | $6,240 | $44,260 |
| 2012 | $1,214 | $52,060 | $6,430 | $45,630 |
Source: Public Records
Map
Nearby Homes
- 431 Overlook Rd
- 421 Edgewood Rd
- 400 Davis Rd
- 655 Woodhill Rd
- 0 George Ave
- 589 Andover Rd
- 505 Wood St
- 181 Chilton Ave
- 1009 Woodhill Rd
- 470 Woodward Ave
- 0 Cline Ave Hedeen Abbeyfeale Unit 9066362
- 501 Clifton Blvd
- 69 Reba Ave
- 679 Coleman Rd
- 353 Sturges Ave
- 709 Coleman Rd
- 654 Courtwright Blvd
- 1125 Larchwood Rd
- 476 Glendale Blvd
- 257 Wood St
- 451 Overlook Rd
- 447 Overlook Rd
- 695 Andover Rd
- 470 Forest Hill Rd
- 475 Overlook Rd
- 441 Overlook Rd
- 464 Overlook Rd
- 437 Overlook Rd
- 484 Forest Hill Rd
- 481 Overlook Rd
- 705 Andover Rd
- 488 Forest Hill Rd
- 450 Overlook Rd
- 475 Forest Hill Rd
- 466 Overlook Rd
- 425 Overlook Rd
- 434 Overlook Rd
- 474 Overlook Rd
- 491 Overlook Rd
- 492 Forest Hill Rd