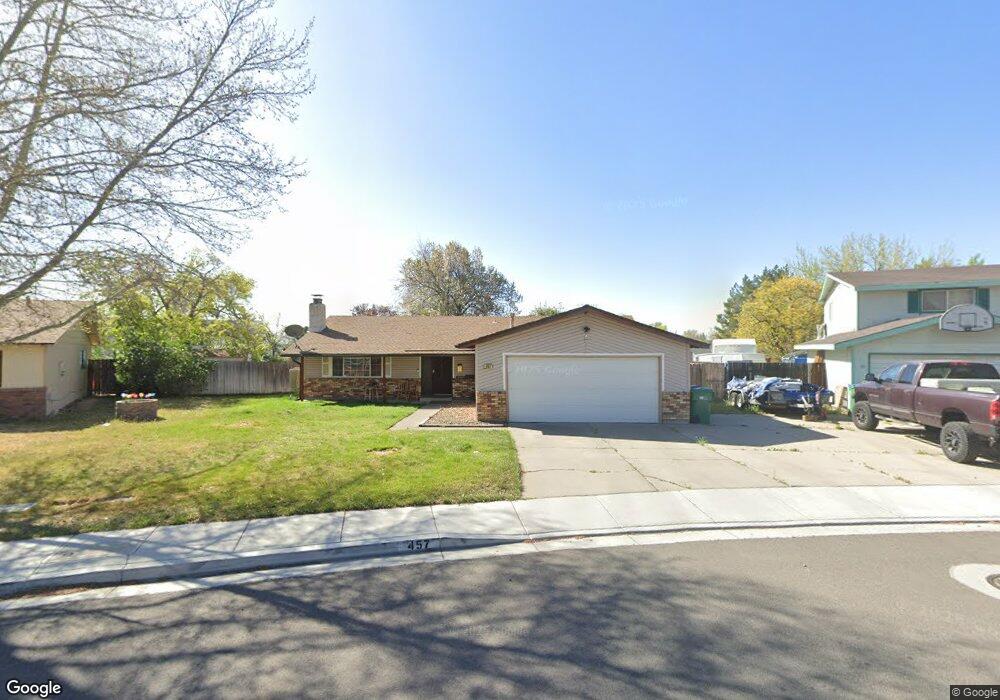
457 Steffanie Way Sparks, NV 89431
McCarran Boulevard-Probasco NeighborhoodEstimated Value: $432,000 - $452,000
3
Beds
2
Baths
1,564
Sq Ft
$283/Sq Ft
Est. Value
About This Home
This home is located at 457 Steffanie Way, Sparks, NV 89431 and is currently estimated at $442,723, approximately $283 per square foot. 457 Steffanie Way is a home located in Washoe County with nearby schools including Hershal H. Beam Elementary School, Lena Juniper Elementary School, and Lou Mendive Middle School.
Ownership History
Date
Name
Owned For
Owner Type
Purchase Details
Closed on
Jun 8, 2001
Sold by
Olson Jon and Olson Jill
Bought by
Dennis Steven P and Dennis Julia J
Current Estimated Value
Home Financials for this Owner
Home Financials are based on the most recent Mortgage that was taken out on this home.
Original Mortgage
$152,838
Outstanding Balance
$58,219
Interest Rate
7.14%
Mortgage Type
FHA
Estimated Equity
$384,504
Purchase Details
Closed on
Nov 24, 1997
Sold by
Spencer Robert A and Luciano Spencer Dana A
Bought by
Olson Jon and Olson Jill
Home Financials for this Owner
Home Financials are based on the most recent Mortgage that was taken out on this home.
Original Mortgage
$126,100
Interest Rate
7.22%
Create a Home Valuation Report for This Property
The Home Valuation Report is an in-depth analysis detailing your home's value as well as a comparison with similar homes in the area
Home Values in the Area
Average Home Value in this Area
Purchase History
| Date | Buyer | Sale Price | Title Company |
|---|---|---|---|
| Dennis Steven P | $155,000 | Founders Title Co | |
| Olson Jon | $130,000 | First American Title Co |
Source: Public Records
Mortgage History
| Date | Status | Borrower | Loan Amount |
|---|---|---|---|
| Open | Dennis Steven P | $152,838 | |
| Previous Owner | Olson Jon | $126,100 |
Source: Public Records
Tax History Compared to Growth
Tax History
| Year | Tax Paid | Tax Assessment Tax Assessment Total Assessment is a certain percentage of the fair market value that is determined by local assessors to be the total taxable value of land and additions on the property. | Land | Improvement |
|---|---|---|---|---|
| 2025 | $1,245 | $60,508 | $36,715 | $23,793 |
| 2024 | $1,210 | $58,192 | $34,755 | $23,437 |
| 2023 | $1,210 | $56,641 | $34,930 | $21,711 |
| 2022 | $1,176 | $46,145 | $28,455 | $17,690 |
| 2021 | $1,143 | $36,869 | $19,635 | $17,234 |
| 2020 | $1,106 | $34,761 | $17,850 | $16,911 |
| 2019 | $1,074 | $35,701 | $18,725 | $16,976 |
| 2018 | $1,044 | $30,766 | $13,545 | $17,221 |
| 2017 | $1,013 | $29,892 | $12,075 | $17,817 |
| 2016 | $986 | $30,261 | $11,550 | $18,711 |
| 2015 | $986 | $28,886 | $9,415 | $19,471 |
| 2014 | $958 | $27,247 | $7,980 | $19,267 |
| 2013 | -- | $25,464 | $5,985 | $19,479 |
Source: Public Records
Map
Nearby Homes
- 780 Emerson Way
- 465 Lenwood Dr
- 3465 Dawn Cir
- 3245 Elaine Way
- 119 Devere Way
- 5650 Wedekind Rd
- 3545 4th St
- 3607 Keogh Dr
- 3252 Holman Way
- 120 E Lenwood Dr
- 3269 Valley Forge Way
- 10 Sheridan Way
- 3595 Rocky Ridge Ct
- 5530 High Rock Way
- 1125 Dodson Way
- 2865 Patrice Dr
- 3071 Meadowlands Dr
- 1940 4th St Unit 20
- 1940 4th St Unit 51
- 1945 4th St Unit 32
- 461 Steffanie Way
- 451 Steffanie Way
- 3323 4th St
- 408 Abbay Way
- 3325 4th St
- 463 Steffanie Way
- 400 Abbay Way
- 445 Steffanie Way
- 3335 4th St
- 414 Abbay Way
- 462 Steffanie Way
- 470 Steffanie Way
- 424 Abbay Way Unit 6
- 479 Steffanie Way
- 3341 4th St
- 439 Steffanie Way
- 458 Steffanie Way
- 478 Steffanie Way
- 432 Abbay Way
- 3343 4th St