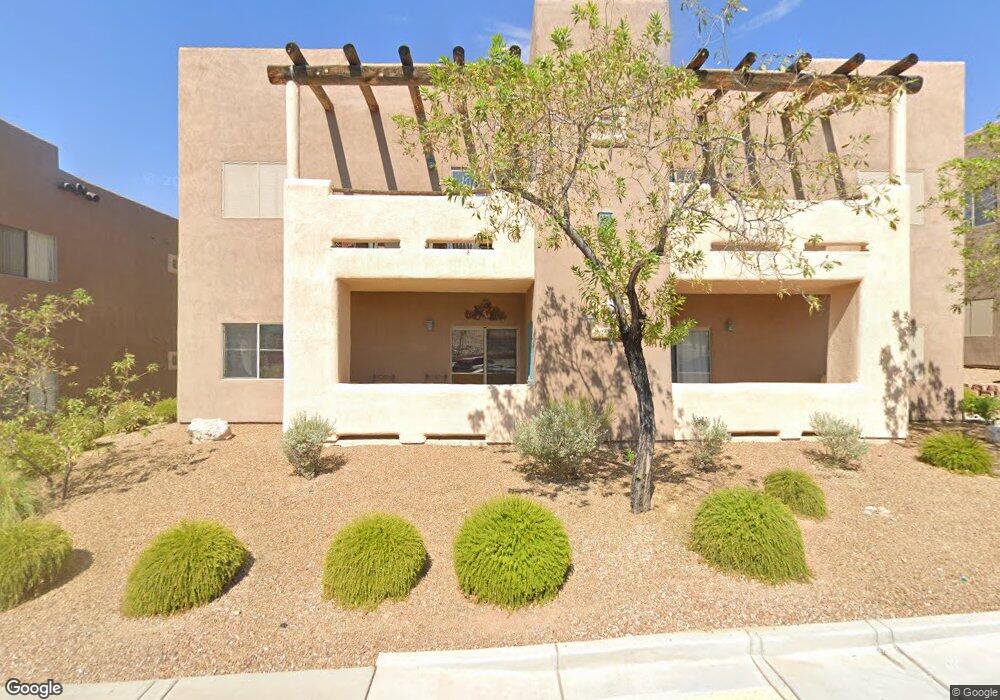
457 Turtleback Rd Unit D Mesquite, NV 89027
Estimated Value: $189,000 - $215,278
2
Beds
2
Baths
1,288
Sq Ft
$159/Sq Ft
Est. Value
About This Home
This home is located at 457 Turtleback Rd Unit D, Mesquite, NV 89027 and is currently estimated at $204,320, approximately $158 per square foot. 457 Turtleback Rd Unit D is a home located in Clark County with nearby schools including Virgin Valley Elementary School, Charles Arthur Hughes Middle School, and Virgin Valley High School.
Ownership History
Date
Name
Owned For
Owner Type
Purchase Details
Closed on
Apr 30, 2020
Sold by
Myers Bene Dee
Bought by
Myers Bene Dee and Dee Myers Living Trust
Current Estimated Value
Home Financials for this Owner
Home Financials are based on the most recent Mortgage that was taken out on this home.
Original Mortgage
$85,000
Outstanding Balance
$75,101
Interest Rate
3.6%
Mortgage Type
New Conventional
Estimated Equity
$129,219
Purchase Details
Closed on
Apr 7, 2008
Sold by
Myers Dee
Bought by
Dee Myers Living Trust
Purchase Details
Closed on
Mar 25, 2008
Sold by
Myers Dee
Bought by
Myers Bene Dee
Purchase Details
Closed on
Sep 7, 2004
Sold by
Red Vistas Llc
Bought by
Bene William J and Myers Dee
Home Financials for this Owner
Home Financials are based on the most recent Mortgage that was taken out on this home.
Original Mortgage
$90,560
Interest Rate
5.69%
Mortgage Type
Unknown
Create a Home Valuation Report for This Property
The Home Valuation Report is an in-depth analysis detailing your home's value as well as a comparison with similar homes in the area
Purchase History
| Date | Buyer | Sale Price | Title Company |
|---|---|---|---|
| Myers Bene Dee | -- | Stewart Title Company F | |
| Myers Bene Dee | -- | Stewart Title Company F | |
| Dee Myers Living Trust | -- | None Available | |
| Myers Bene Dee | -- | None Available | |
| Bene William J | $113,595 | Fidelity National Title |
Source: Public Records
Mortgage History
| Date | Status | Borrower | Loan Amount |
|---|---|---|---|
| Open | Myers Bene Dee | $85,000 | |
| Previous Owner | Bene William J | $90,560 |
Source: Public Records
Tax History
| Year | Tax Paid | Tax Assessment Tax Assessment Total Assessment is a certain percentage of the fair market value that is determined by local assessors to be the total taxable value of land and additions on the property. | Land | Improvement |
|---|---|---|---|---|
| 2026 | $924 | $59,119 | $15,750 | $43,369 |
| 2025 | $857 | $59,802 | $16,450 | $43,352 |
| 2024 | $794 | $59,802 | $16,450 | $43,352 |
| 2023 | $794 | $59,372 | $19,600 | $39,772 |
| 2022 | $735 | $53,127 | $16,450 | $36,677 |
| 2021 | $681 | $45,604 | $11,200 | $34,404 |
| 2020 | $609 | $43,576 | $11,200 | $32,376 |
| 2019 | $591 | $38,385 | $11,200 | $27,185 |
| 2018 | $574 | $33,426 | $6,300 | $27,126 |
| 2017 | $836 | $30,149 | $5,950 | $24,199 |
| 2016 | $543 | $24,975 | $4,200 | $20,775 |
| 2015 | $542 | $18,970 | $3,500 | $15,470 |
| 2014 | $526 | $18,495 | $5,250 | $13,245 |
Source: Public Records
Map
Nearby Homes
- 465 Turtleback Rd Unit B
- 518 Turtleback Rd Unit C
- 498 Canyon View Way
- 378 Colleen Ct Unit C
- 529 Canyon Way
- 260 Haley Way Unit 157
- 555 Highland Dr Unit 330
- 430 Chalet Dr
- 563 Fairways Dr
- 744 Pinnacle Ct
- 870 Ironwood Dr
- 241 Palmer Ln
- 121 Hermosa Way
- 228 Hiawatha Way
- 997 Jade St
- 401 Honeysuckle Ln
- 686 Mayan Cir
- 601 Hillside Dr
- 238 Thistle St
- 262 Thistle St
- 457 Turtleback Rd Unit B
- 457 Turtleback Rd Unit D
- 457 Turtle Back Rd Unit C
- 457 Turtle Back Rd Unit B
- 457 Turtle Back Rd Unit D
- 457 Turtle Back Rd Unit A
- 457 Turtle Back Rd Unit D
- 457 Turtle Back Rd Unit C
- 457 Turtle Back Rd Mesquite Nv B
- 465 Turtle Back Rd Unit D
- 465 Turtle Back Rd Unit C
- 465 Turtle Back Rd Unit B
- 465 Turtle Back Rd Unit A
- 449 Turtle Back Rd Unit D
- 449 Turtle Back Rd Unit A
- 449 Turtle Back Rd Unit C
- 449 Turtle Back Rd Unit B
- 449 Turtleback Rd
- 449 Turtle Back Rd
- 473 Turtleback Rd Unit C
Your Personal Tour Guide
Ask me questions while you tour the home.