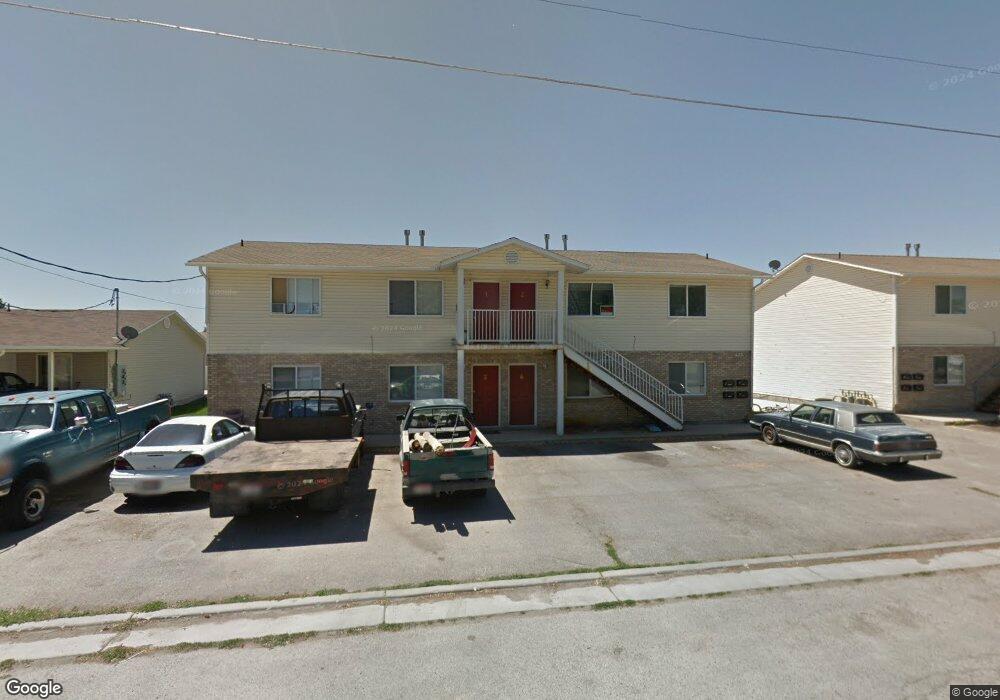
457 W 2nd S Preston, ID 83263
Estimated Value: $371,719
8
Beds
4
Baths
3,360
Sq Ft
$111/Sq Ft
Est. Value
About This Home
This home is located at 457 W 2nd S, Preston, ID 83263 and is currently estimated at $371,719, approximately $110 per square foot. 457 W 2nd S is a home located in Franklin County with nearby schools including Oakwood Elementary School, Pioneer Elementary School, and Preston Junior High School.
Ownership History
Date
Name
Owned For
Owner Type
Purchase Details
Closed on
Apr 19, 2016
Sold by
Bingham Corrie L and Bingham Drexel
Bought by
Square Peak Properties Llc
Current Estimated Value
Home Financials for this Owner
Home Financials are based on the most recent Mortgage that was taken out on this home.
Original Mortgage
$153,750
Outstanding Balance
$122,145
Interest Rate
3.68%
Mortgage Type
Commercial
Estimated Equity
$249,574
Purchase Details
Closed on
Apr 18, 2016
Sold by
Lindley Terry L and Lindley Sandra Lee
Bought by
Bingham Corrie L and Bingham Drexel
Home Financials for this Owner
Home Financials are based on the most recent Mortgage that was taken out on this home.
Original Mortgage
$153,750
Outstanding Balance
$122,145
Interest Rate
3.68%
Mortgage Type
Commercial
Estimated Equity
$249,574
Create a Home Valuation Report for This Property
The Home Valuation Report is an in-depth analysis detailing your home's value as well as a comparison with similar homes in the area
Home Values in the Area
Average Home Value in this Area
Purchase History
| Date | Buyer | Sale Price | Title Company |
|---|---|---|---|
| Square Peak Properties Llc | -- | Northern Title Co | |
| Bingham Corrie L | -- | Northern Title Co |
Source: Public Records
Mortgage History
| Date | Status | Borrower | Loan Amount |
|---|---|---|---|
| Open | Bingham Corrie L | $153,750 |
Source: Public Records
Tax History
| Year | Tax Paid | Tax Assessment Tax Assessment Total Assessment is a certain percentage of the fair market value that is determined by local assessors to be the total taxable value of land and additions on the property. | Land | Improvement |
|---|---|---|---|---|
| 2025 | $3,261 | $352,014 | $60,000 | $292,014 |
| 2024 | $3,412 | $352,014 | $60,000 | $292,014 |
| 2023 | $3,430 | $352,175 | $60,000 | $292,175 |
| 2022 | $2,230 | $169,811 | $30,398 | $139,413 |
| 2021 | $2,410 | $169,811 | $30,398 | $139,413 |
| 2019 | $2,746 | $167,991 | $28,578 | $139,413 |
| 2018 | $2,853 | $169,237 | $28,578 | $140,659 |
| 2017 | $2,730 | $169,237 | $28,578 | $140,659 |
| 2016 | $2,871 | $168,126 | $28,578 | $139,548 |
| 2015 | $1,399 | $168,126 | $28,578 | $139,548 |
| 2014 | $46,382 | $168,125 | $28,577 | $139,548 |
| 2013 | $41,009 | $168,260 | $28,580 | $139,680 |
Source: Public Records
Map
Nearby Homes