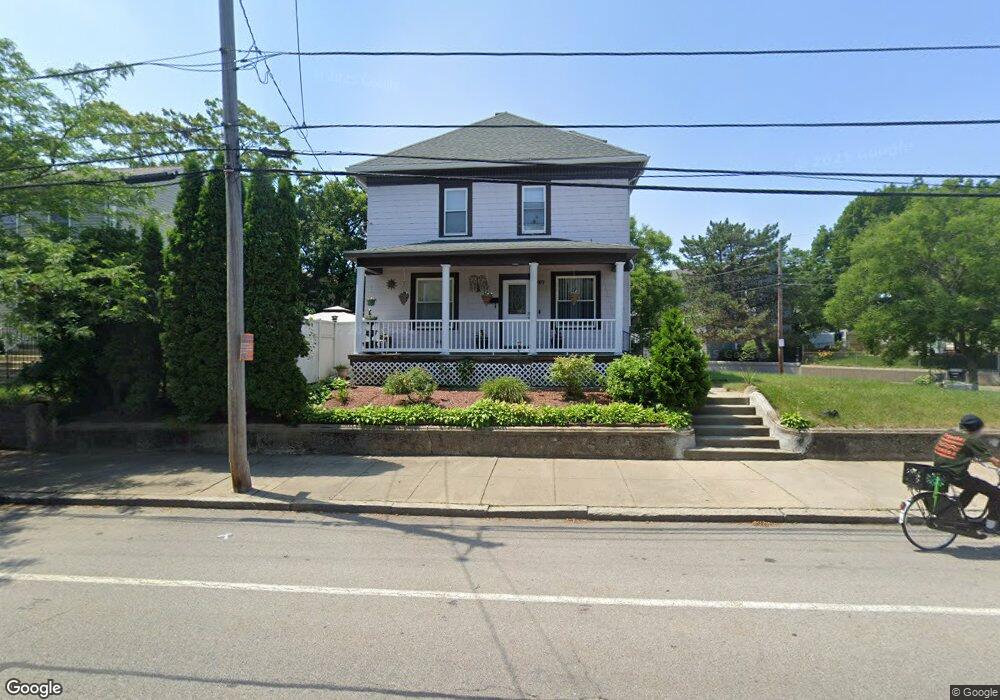
457 West Ave Pawtucket, RI 02860
Woodlawn NeighborhoodEstimated Value: $402,307 - $563,000
4
Beds
2
Baths
1,820
Sq Ft
$264/Sq Ft
Est. Value
About This Home
This home is located at 457 West Ave, Pawtucket, RI 02860 and is currently estimated at $480,827, approximately $264 per square foot. 457 West Ave is a home located in Providence County with nearby schools including International Charter School, Blackstone Academy Charter School, and Ocean Tides School.
Ownership History
Date
Name
Owned For
Owner Type
Purchase Details
Closed on
Jan 29, 2013
Sold by
Harrington Shawn J and Mundrean Lazar
Bought by
Fernandes James and Fernandes Mark
Current Estimated Value
Purchase Details
Closed on
Jan 22, 2010
Sold by
Mundrean Lazar and Harrington Shawn
Bought by
Conceicao Mario and Soares Odeair
Home Financials for this Owner
Home Financials are based on the most recent Mortgage that was taken out on this home.
Original Mortgage
$171,830
Interest Rate
4.79%
Mortgage Type
Purchase Money Mortgage
Purchase Details
Closed on
Mar 25, 2009
Sold by
Citibank Na
Bought by
Harrington Shawn J and Mundrean Lazar
Purchase Details
Closed on
Nov 14, 2008
Sold by
Brown Debra
Bought by
Citibank Na
Purchase Details
Closed on
Dec 5, 2003
Sold by
Hope Est
Bought by
Pedro Jason G
Purchase Details
Closed on
Oct 20, 1999
Sold by
Vetter Laureen A
Bought by
Brown Debra M
Create a Home Valuation Report for This Property
The Home Valuation Report is an in-depth analysis detailing your home's value as well as a comparison with similar homes in the area
Home Values in the Area
Average Home Value in this Area
Purchase History
| Date | Buyer | Sale Price | Title Company |
|---|---|---|---|
| Fernandes James | $20,000 | -- | |
| Conceicao Mario | $175,000 | -- | |
| Harrington Shawn J | $62,600 | -- | |
| Citibank Na | $175,000 | -- | |
| Pedro Jason G | $235,000 | -- | |
| Brown Debra M | $88,500 | -- |
Source: Public Records
Mortgage History
| Date | Status | Borrower | Loan Amount |
|---|---|---|---|
| Previous Owner | Brown Debra M | $171,830 | |
| Previous Owner | Brown Debra M | $245,000 |
Source: Public Records
Tax History Compared to Growth
Tax History
| Year | Tax Paid | Tax Assessment Tax Assessment Total Assessment is a certain percentage of the fair market value that is determined by local assessors to be the total taxable value of land and additions on the property. | Land | Improvement |
|---|---|---|---|---|
| 2025 | $3,031 | $230,500 | $73,300 | $157,200 |
| 2024 | $2,844 | $230,500 | $73,300 | $157,200 |
| 2023 | $3,247 | $191,700 | $40,700 | $151,000 |
| 2022 | $3,178 | $191,700 | $40,700 | $151,000 |
| 2021 | $3,178 | $191,700 | $40,700 | $151,000 |
| 2020 | $3,618 | $173,200 | $54,300 | $118,900 |
| 2019 | $3,618 | $173,200 | $54,300 | $118,900 |
| 2018 | $3,487 | $173,200 | $54,300 | $118,900 |
| 2017 | $3,715 | $163,500 | $53,200 | $110,300 |
| 2016 | $3,579 | $163,500 | $53,200 | $110,300 |
| 2015 | $3,579 | $163,500 | $53,200 | $110,300 |
| 2014 | $4,036 | $175,000 | $53,200 | $121,800 |
Source: Public Records
Map
Nearby Homes