
Seller's Agent in 2022
Gretchen Ballard
F.C. TUCKER EMGE
(812) 305-5300
11 in this area
107 Total Sales
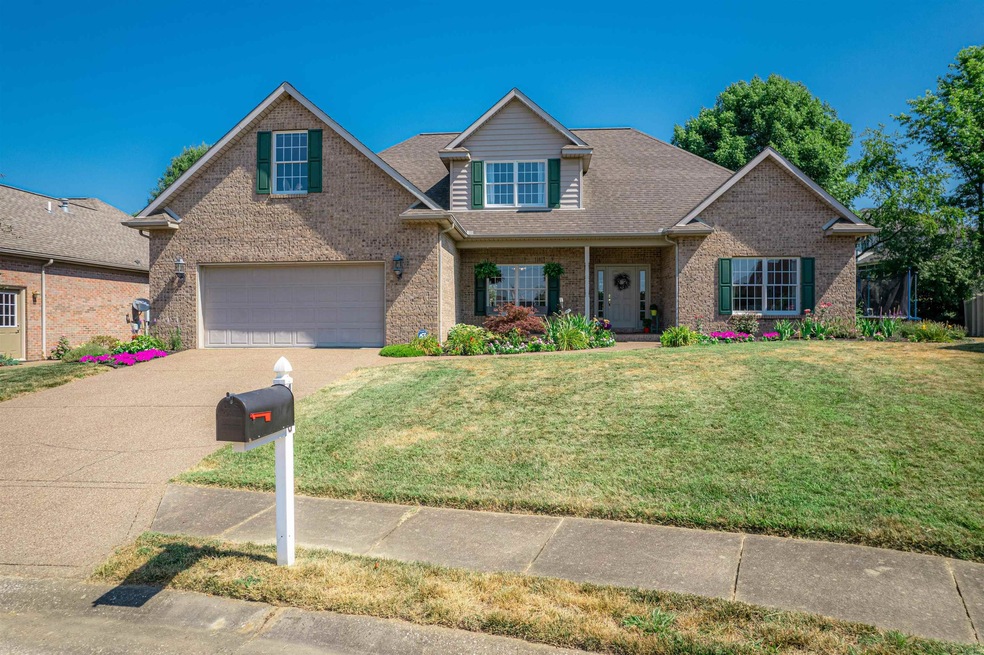
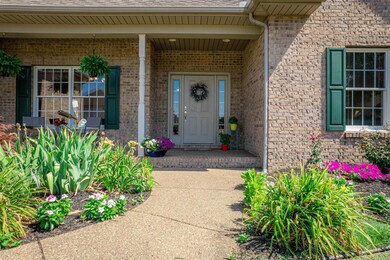
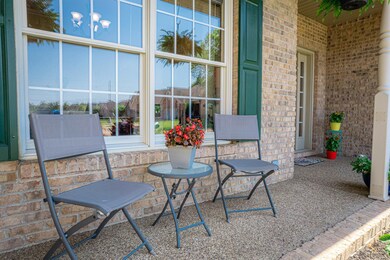

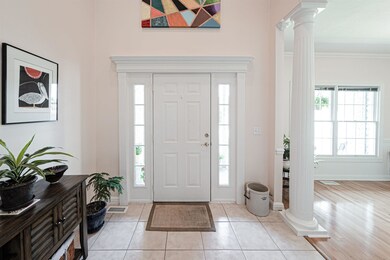
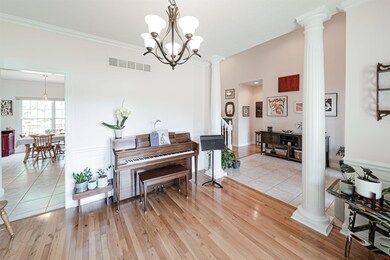
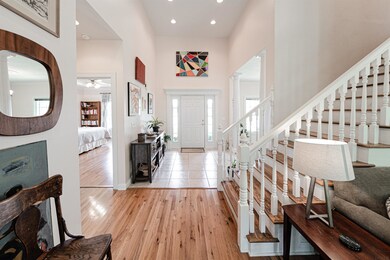
This house has been meticulously maintained and is ready for you to call it home. The covered front porch greets you into the large open foyer. You will love how the entry provides access to both the dining room and the living room which offers high ceilings, a gas log fireplace and an abundance of natural light. The living room is open to the very large eat-in kitchen. You will not lack for storage in this kitchen with its castled oak cabinetry along with a nice sized pantry. Just off the kitchen is a conveniently located half bath and a roomy laundry room. Also downstairs is the primary bedroom with en suite. This bedroom offers a trey ceiling, recessed lighting and ceiling fan. The en suite bathroom boasts a large walk in closet, dual vanity, stand alone shower and large whirlpool tub. Upstairs are two spacious bedrooms, both with large closets, another full bathroom and a bonus room. Outside is a deck that provides ample space for entertaining. This is the home you have been waiting for!
| Date | Type | Sale Price | Title Company |
|---|---|---|---|
| Warranty Deed | -- | Regional Title | |
| Deed | -- | -- | |
| Warranty Deed | -- | None Available | |
| Warranty Deed | -- | None Available |
| Date | Status | Loan Amount | Loan Type |
|---|---|---|---|
| Open | $163,000 | New Conventional | |
| Closed | $130,000 | New Conventional | |
| Previous Owner | $224,910 | No Value Available | |
| Previous Owner | -- | No Value Available | |
| Previous Owner | $224,910 | New Conventional | |
| Previous Owner | $184,000 | New Conventional | |
| Previous Owner | $181,600 | Adjustable Rate Mortgage/ARM |
| Date | Event | Price | Change | Sq Ft Price |
|---|---|---|---|---|
| 08/04/2022 08/04/22 | Sold | $363,000 | -0.5% | $120 / Sq Ft |
| 07/06/2022 07/06/22 | Pending | -- | -- | -- |
| 07/05/2022 07/05/22 | For Sale | $364,900 | +46.0% | $121 / Sq Ft |
| 11/07/2016 11/07/16 | Sold | $249,900 | -2.0% | $97 / Sq Ft |
| 09/30/2016 09/30/16 | Pending | -- | -- | -- |
| 09/14/2016 09/14/16 | For Sale | $254,900 | 0.0% | $99 / Sq Ft |
| 08/15/2015 08/15/15 | Rented | $1,895 | 0.0% | -- |
| 08/08/2015 08/08/15 | Under Contract | -- | -- | -- |
| 08/08/2015 08/08/15 | For Rent | $1,895 | -- | -- |
| Year | Tax Paid | Tax Assessment Tax Assessment Total Assessment is a certain percentage of the fair market value that is determined by local assessors to be the total taxable value of land and additions on the property. | Land | Improvement |
|---|---|---|---|---|
| 2024 | $2,548 | $372,200 | $61,700 | $310,500 |
| 2023 | $2,007 | $314,400 | $24,500 | $289,900 |
| 2022 | $2,091 | $308,500 | $24,500 | $284,000 |
| 2021 | $2,311 | $275,500 | $24,500 | $251,000 |
| 2020 | $2,276 | $260,300 | $23,100 | $237,200 |
| 2019 | $2,045 | $233,600 | $23,100 | $210,500 |
| 2018 | $1,983 | $236,100 | $23,100 | $213,000 |
| 2017 | $1,968 | $235,800 | $23,100 | $212,700 |
| 2016 | $1,946 | $234,800 | $23,100 | $211,700 |
| 2014 | $1,810 | $232,400 | $21,000 | $211,400 |
| 2013 | $1,827 | $238,400 | $21,000 | $217,400 |
Seller's Agent in 2022
Gretchen Ballard
F.C. TUCKER EMGE
(812) 305-5300
11 in this area
107 Total Sales
Buyer's Agent in 2022
Steven Dossett
F.C. TUCKER EMGE
(812) 449-9222
13 in this area
147 Total Sales
Seller's Agent in 2016
Johnna Hancock-Blake
Berkshire Hathaway HomeServices Indiana Realty
(812) 449-9056
26 in this area
263 Total Sales
A
Seller Co-Listing Agent in 2016
Amy Hammett
Berkshire Hathaway HomeServices Indiana Realty
M
Seller's Agent in 2015
Michael Cain
RE/MAX
(812) 228-5488
1 in this area
7 Total Sales
Source: Indiana Regional MLS
MLS Number: 202227553
APN: 87-12-28-206-015.000-019
Disclaimer: Certain information contained herein is derived from information provided by parties other than Homes.com. All information provided is deemed reliable, but is not guaranteed to be accurate and should be independently verified.
![]() IDX information is provided exclusively for personal, non-commercial use, and may not be used for any purpose other than to identify prospective properties consumers may be interested in purchasing. Information is deemed reliable but not guaranteed.
IDX information is provided exclusively for personal, non-commercial use, and may not be used for any purpose other than to identify prospective properties consumers may be interested in purchasing. Information is deemed reliable but not guaranteed.