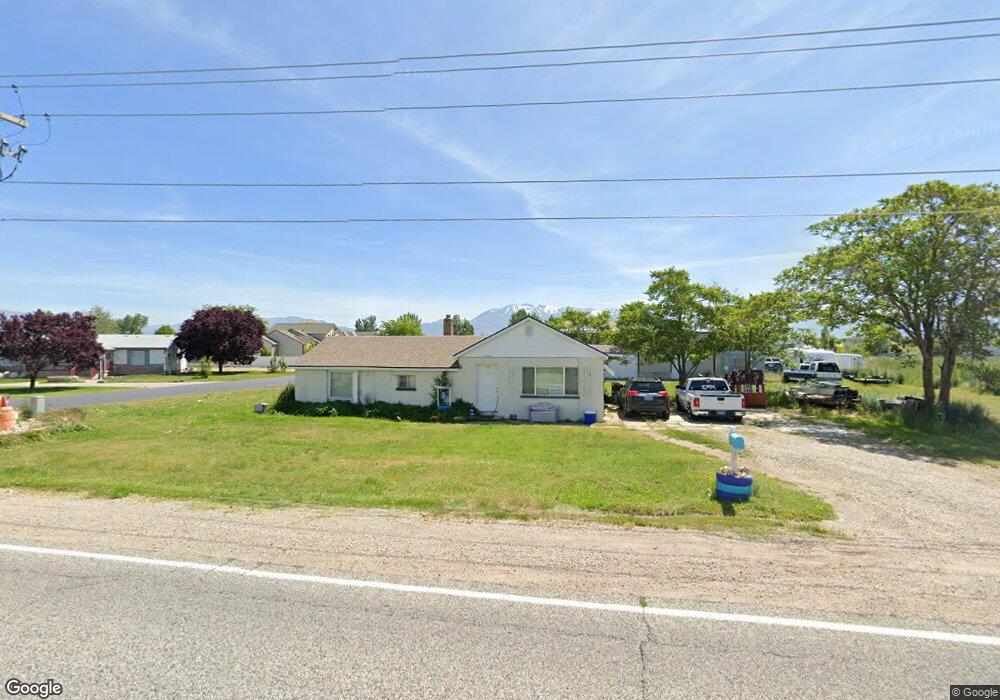
4572 S 4300 W West Haven, UT 84401
Estimated Value: $391,000 - $485,000
3
Beds
1
Bath
1,181
Sq Ft
$377/Sq Ft
Est. Value
About This Home
This home is located at 4572 S 4300 W, West Haven, UT 84401 and is currently estimated at $445,608, approximately $377 per square foot. 4572 S 4300 W is a home located in Weber County with nearby schools including West Haven School, Sand Ridge Junior High School, and Roy High School.
Ownership History
Date
Name
Owned For
Owner Type
Purchase Details
Closed on
Jan 17, 2017
Sold by
Robinson Eric L
Bought by
Robinson Eric
Current Estimated Value
Home Financials for this Owner
Home Financials are based on the most recent Mortgage that was taken out on this home.
Original Mortgage
$63,819
Outstanding Balance
$48,220
Interest Rate
3.87%
Mortgage Type
FHA
Estimated Equity
$397,388
Purchase Details
Closed on
Jul 22, 1999
Sold by
Barrera Tamera Petersen and Petersen Tamera
Bought by
Robinson Eric L
Home Financials for this Owner
Home Financials are based on the most recent Mortgage that was taken out on this home.
Original Mortgage
$101,037
Interest Rate
7.51%
Mortgage Type
FHA
Purchase Details
Closed on
Sep 4, 1998
Sold by
Petersen Nio Lee H
Bought by
Barrera Tamera Petersen and Petersen Tamera
Create a Home Valuation Report for This Property
The Home Valuation Report is an in-depth analysis detailing your home's value as well as a comparison with similar homes in the area
Home Values in the Area
Average Home Value in this Area
Purchase History
| Date | Buyer | Sale Price | Title Company |
|---|---|---|---|
| Robinson Eric | -- | Hickman Land Title Co | |
| Robinson Eric L | -- | Associated Title | |
| Barrera Tamera Petersen | -- | -- |
Source: Public Records
Mortgage History
| Date | Status | Borrower | Loan Amount |
|---|---|---|---|
| Open | Robinson Eric | $63,819 | |
| Closed | Robinson Eric L | $101,037 |
Source: Public Records
Tax History Compared to Growth
Tax History
| Year | Tax Paid | Tax Assessment Tax Assessment Total Assessment is a certain percentage of the fair market value that is determined by local assessors to be the total taxable value of land and additions on the property. | Land | Improvement |
|---|---|---|---|---|
| 2025 | $1,948 | $349,209 | $176,608 | $172,601 |
| 2024 | $1,889 | $189,748 | $97,134 | $92,614 |
| 2023 | $1,657 | $165,000 | $97,134 | $67,866 |
| 2022 | $1,604 | $163,350 | $97,134 | $66,216 |
| 2021 | $1,403 | $242,000 | $90,721 | $151,279 |
| 2020 | $1,429 | $226,000 | $76,075 | $149,925 |
| 2019 | $1,323 | $198,000 | $77,194 | $120,806 |
| 2018 | $1,180 | $169,000 | $63,228 | $105,772 |
| 2017 | $1,078 | $149,999 | $64,502 | $85,497 |
| 2016 | $1,063 | $79,998 | $28,815 | $51,183 |
| 2015 | $1,045 | $77,561 | $28,815 | $48,746 |
| 2014 | $870 | $62,999 | $28,815 | $34,184 |
Source: Public Records
Map
Nearby Homes
- 4756 S 4300 W
- 4094 W 4700 S
- 4097 W 4750 S
- 4024 W 4650 S
- 4106 W 4875 S
- 4141 W 4875 S
- 4890 S 4075 W
- 5013 S 4150 W
- 4556 W 4950 S
- 4218 W 5050 S
- 4990 S 4075 W
- 4021 W 5000 S
- 5116 S 4300 W
- 4931 S 4700 W
- 3692 W 4625 S
- 5270 S 4200 W
- 3671 W 4700 S
- 3820 Foxglen Dr
- 3652 W 4625 S
- Villages Townhome Plan at Green Farm - Villages