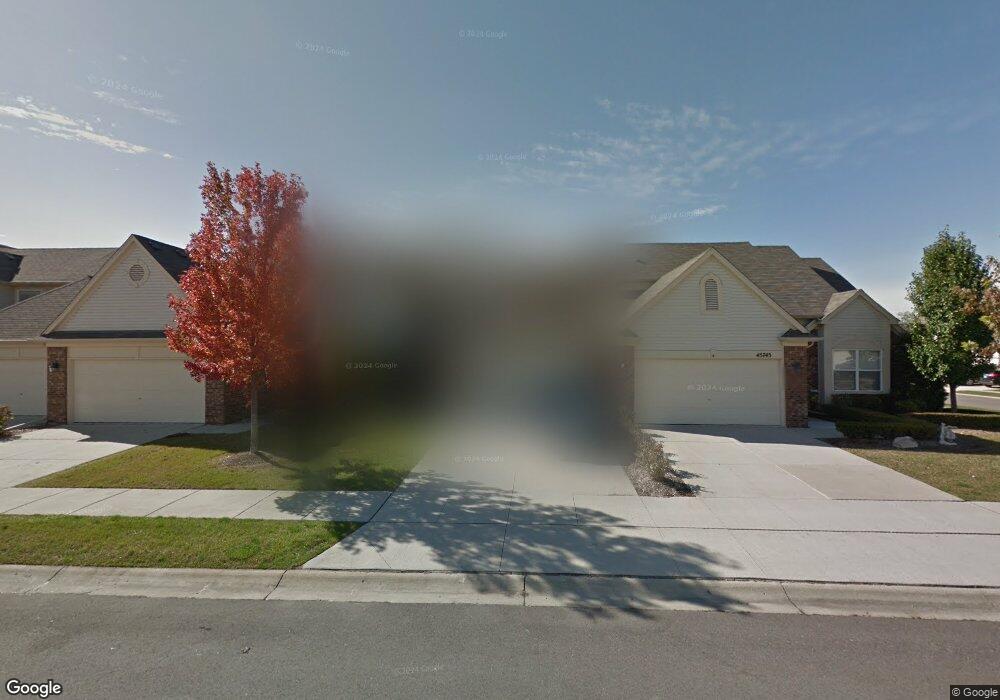
45727 Rathmore Dr Unit 85 Macomb, MI 48044
Estimated Value: $299,000 - $328,000
--
Bed
2
Baths
1,322
Sq Ft
$236/Sq Ft
Est. Value
About This Home
This home is located at 45727 Rathmore Dr Unit 85, Macomb, MI 48044 and is currently estimated at $311,374, approximately $235 per square foot. 45727 Rathmore Dr Unit 85 is a home located in Macomb County with nearby schools including Cherokee Elementary School, Wyandot Middle School, and Chippewa Valley High School.
Ownership History
Date
Name
Owned For
Owner Type
Purchase Details
Closed on
Sep 22, 2022
Sold by
Picarella Sam and Picarella Loretta
Bought by
Picarella Loretta and Bisby Deanna Lynn
Current Estimated Value
Purchase Details
Closed on
Nov 13, 2013
Sold by
Windemere Farms Ii Llc
Bought by
Picarella Sam and Picarella Loretta
Purchase Details
Closed on
Dec 3, 2010
Sold by
Gtr Windemere Inc
Bought by
Windemere Farms Ii Llc
Purchase Details
Closed on
Jun 24, 2010
Sold by
The Privatebank & Trust Company
Bought by
Pb Real Estate Llc
Purchase Details
Closed on
May 28, 2010
Sold by
Gtr Windemere Inc
Bought by
The Privatebank
Create a Home Valuation Report for This Property
The Home Valuation Report is an in-depth analysis detailing your home's value as well as a comparison with similar homes in the area
Home Values in the Area
Average Home Value in this Area
Purchase History
| Date | Buyer | Sale Price | Title Company |
|---|---|---|---|
| Picarella Loretta | -- | -- | |
| Picarella Loretta | -- | None Listed On Document | |
| Picarella Sam | $150,000 | None Available | |
| Windemere Farms Ii Llc | -- | None Available | |
| Pb Real Estate Llc | -- | None Available | |
| The Privatebank | $85,913 | None Available |
Source: Public Records
Tax History Compared to Growth
Tax History
| Year | Tax Paid | Tax Assessment Tax Assessment Total Assessment is a certain percentage of the fair market value that is determined by local assessors to be the total taxable value of land and additions on the property. | Land | Improvement |
|---|---|---|---|---|
| 2025 | $2,760 | $142,600 | $0 | $0 |
| 2024 | $2,125 | $131,600 | $0 | $0 |
| 2023 | $2,016 | $108,100 | $0 | $0 |
| 2022 | $2,504 | $102,000 | $0 | $0 |
| 2021 | $2,789 | $101,600 | $0 | $0 |
| 2020 | $1,850 | $97,600 | $0 | $0 |
| 2019 | $2,455 | $97,100 | $0 | $0 |
| 2018 | $2,527 | $88,300 | $0 | $0 |
| 2017 | $2,492 | $82,230 | $18,500 | $63,730 |
| 2016 | $2,334 | $82,270 | $0 | $0 |
| 2015 | $2,373 | $79,150 | $0 | $0 |
| 2014 | $2,373 | $58,210 | $12,500 | $45,710 |
| 2011 | $649 | $60,660 | $10,500 | $50,160 |
Source: Public Records
Map
Nearby Homes
- 20819 Burn Dr
- 20811 Burn Dr
- 20800 Burn Dr
- 20795 Burn Dr
- The Bradbury Plan at Windemere Farms
- The Glenbury Plan at Windemere Farms
- The Bradbury II Plan at Windemere Farms
- 20779 Burn Dr
- 20776 Burn Dr
- 20771 Burn Dr
- 45687 Cagney Dr Unit 70
- 45550 Rathmore Dr Unit 278
- 20768 Burn Dr
- 45705 Cagney Dr Unit 63
- 20832 Burn Dr
- 45731 Beaufort Dr
- 45914 Portsville Dr
- 20346 Windham Dr
- 20391 Windham Dr
- 20394 Country Side Dr
- 45709 Rathmore Dr Unit 84
- 45745 Rathmore Dr Unit 86
- 45703 Rathmore Dr Unit 83
- 45685 Rathmore Dr Unit 82
- 45667 Rathmore Dr Unit 81
- 45709 Rathmore Dr Unit 17 84
- 45766 Rathmore Dr Unit 266
- 45672 Limerick Dr Unit 92
- 45690 Limerick Dr Unit 91
- 45700 Limerick Dr Unit 90
- 45726 Limerick Dr Unit 89
- 45762 Limerick Dr Unit 87
- 45690 Limerick Dr Unit 18 91
- 45726 Limerick Dr Unit 87
- 45658 Rathmore Dr Unit 272
- 45622 Rathmore Dr Unit 274
- 45640 Rathmore Dr Unit 273
- 45676 Rathmore Dr Unit 271
- 45694 Rathmore Dr Unit 270
- 45744 Limerick Dr Unit 88