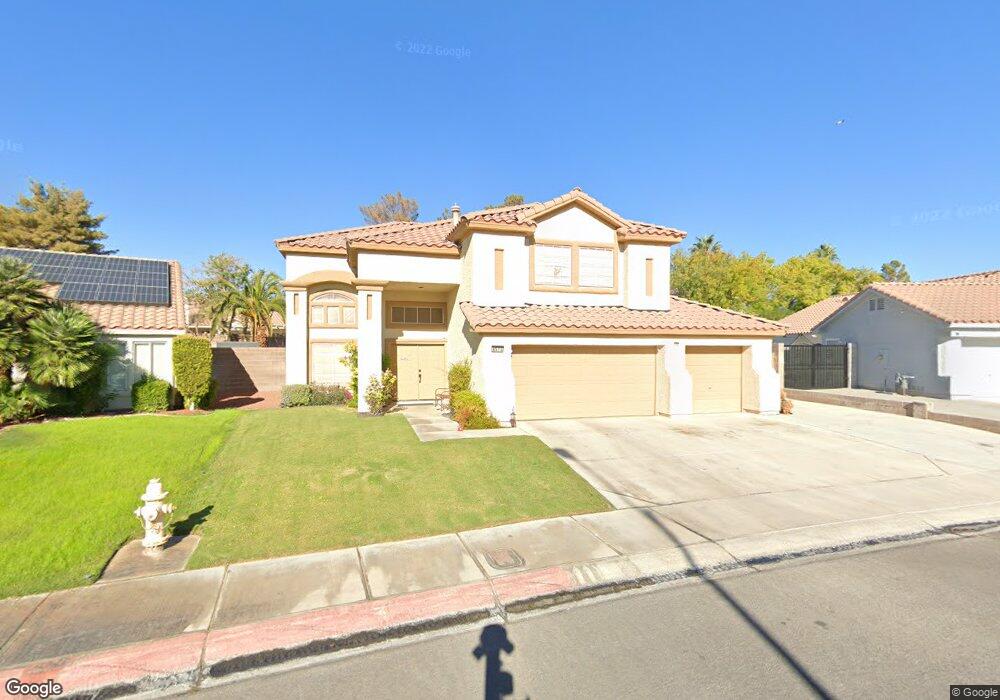
4573 Cielo Ln Las Vegas, NV 89130
North Cheyenne NeighborhoodEstimated Value: $490,511 - $523,000
3
Beds
3
Baths
2,237
Sq Ft
$228/Sq Ft
Est. Value
About This Home
This home is located at 4573 Cielo Ln, Las Vegas, NV 89130 and is currently estimated at $511,128, approximately $228 per square foot. 4573 Cielo Ln is a home located in Clark County with nearby schools including Ernest May Elementary School, Theron L Swainston Middle School, and Cheyenne High School.
Ownership History
Date
Name
Owned For
Owner Type
Purchase Details
Closed on
May 7, 2022
Sold by
Malee Hulbert
Bought by
Hulbert Murl J
Current Estimated Value
Home Financials for this Owner
Home Financials are based on the most recent Mortgage that was taken out on this home.
Original Mortgage
$166,000
Outstanding Balance
$156,460
Interest Rate
4.42%
Mortgage Type
New Conventional
Estimated Equity
$354,668
Purchase Details
Closed on
Oct 27, 2005
Sold by
Hulbert James William
Bought by
Hulbert Malee
Purchase Details
Closed on
Oct 26, 2005
Sold by
Hulbert Malee
Bought by
Hulbert Malee
Purchase Details
Closed on
Apr 26, 1995
Sold by
Easterly Benjamin D and Easterly Lynn M
Bought by
Hulbert James William and Hulbert Malee
Home Financials for this Owner
Home Financials are based on the most recent Mortgage that was taken out on this home.
Original Mortgage
$150,000
Interest Rate
8.32%
Mortgage Type
Assumption
Create a Home Valuation Report for This Property
The Home Valuation Report is an in-depth analysis detailing your home's value as well as a comparison with similar homes in the area
Home Values in the Area
Average Home Value in this Area
Purchase History
| Date | Buyer | Sale Price | Title Company |
|---|---|---|---|
| Hulbert Murl J | $490,000 | First American Title | |
| Hulbert Malee | -- | Lawyers Title Of Nevada | |
| Hulbert Malee | -- | Lawyers Title Of Nevada | |
| Hulbert James William | $150,000 | Old Republic Title Company |
Source: Public Records
Mortgage History
| Date | Status | Borrower | Loan Amount |
|---|---|---|---|
| Open | Hulbert Murl J | $166,000 | |
| Previous Owner | Hulbert James William | $150,000 |
Source: Public Records
Tax History Compared to Growth
Tax History
| Year | Tax Paid | Tax Assessment Tax Assessment Total Assessment is a certain percentage of the fair market value that is determined by local assessors to be the total taxable value of land and additions on the property. | Land | Improvement |
|---|---|---|---|---|
| 2025 | $2,422 | $100,611 | $38,115 | $62,496 |
| 2024 | $2,243 | $100,611 | $38,115 | $62,496 |
| 2023 | $2,243 | $95,402 | $35,420 | $59,982 |
| 2022 | $2,077 | $84,399 | $29,260 | $55,139 |
| 2021 | $1,924 | $78,496 | $25,795 | $52,701 |
| 2020 | $1,783 | $77,102 | $24,640 | $52,462 |
| 2019 | $1,671 | $73,571 | $21,560 | $52,011 |
| 2018 | $1,595 | $67,754 | $17,710 | $50,044 |
| 2017 | $2,188 | $66,736 | $15,785 | $50,951 |
| 2016 | $1,493 | $62,931 | $11,550 | $51,381 |
| 2015 | $1,490 | $54,408 | $9,625 | $44,783 |
| 2014 | $1,443 | $45,814 | $7,700 | $38,114 |
Source: Public Records
Map
Nearby Homes
- 5309 Camino Del Rancho
- 5213 Red Glory Dr
- 4708 Royal Sunset Ct
- 5213 Tamanar Dr
- 4801 Fiesta Lakes St
- 4708 English Ivy Ct
- 4808 Fiesta Lakes St
- 5004 Camino Del Rancho
- 4817 Friar Ln
- 4816 Fiesta Lakes St
- 4821 Fiesta Lakes St
- 5104 Brookmere Dr
- 4833 Fiesta Lakes St
- 4852 Maryvale Dr
- 4401 Inez Dr
- 4872 Maryvale Dr
- 5812 Ventana Dr
- 4905 Ocean Shores Way
- 4800 Baffin Ct
- 4904 Pinon Dr
- 4569 Cielo Ln
- 4577 Cielo Ln
- 4572 Gonzales Dr Unit 4572
- 4572 Gonzales Dr
- 4572 Gonzales Dr Unit n/a
- 5353 Venado Dr
- 4600 Gonzales Dr Unit 10A
- 4565 Cielo Ln
- 8089 Cielo Ln
- 4568 Gonzales Dr
- 4604 Gonzales Dr
- 4576 Cielo Ln
- 4568 Cielo Ln
- 4564 Gonzales Dr
- 4561 Cielo Ln
- 4608 Gonzales Dr
- 5300 Venado Dr
- 4580 Cielo Ln
- 4560 Gonzales Dr
- 4560 Cielo Ln