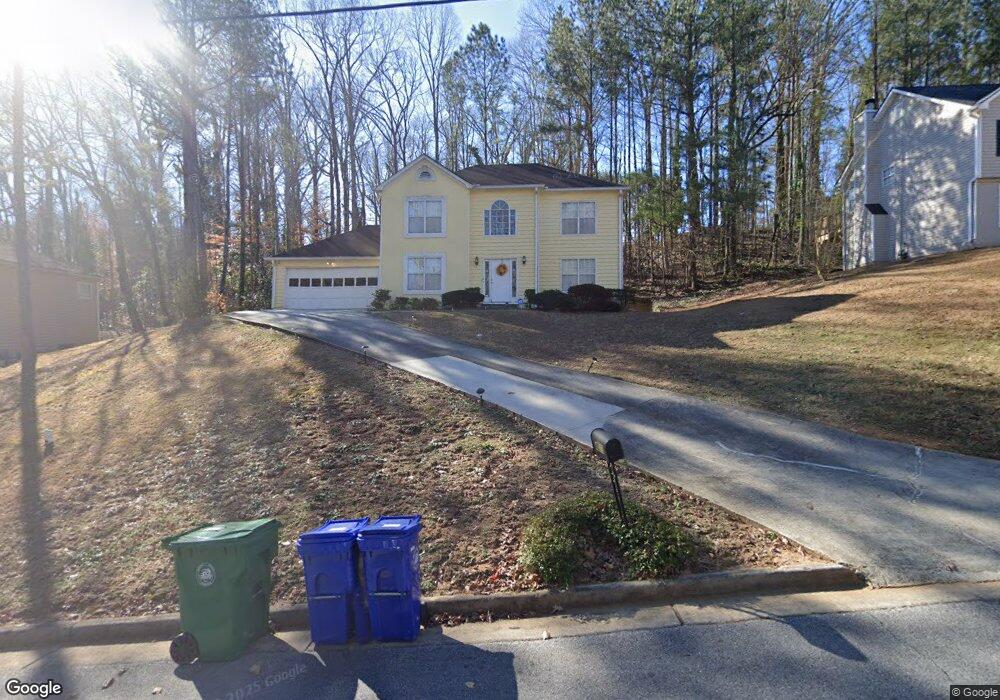
4573 Moon Valley Ln Unit 1 Lithonia, GA 30038
Estimated Value: $269,582 - $297,000
4
Beds
3
Baths
1,928
Sq Ft
$149/Sq Ft
Est. Value
About This Home
This home is located at 4573 Moon Valley Ln Unit 1, Lithonia, GA 30038 and is currently estimated at $286,396, approximately $148 per square foot. 4573 Moon Valley Ln Unit 1 is a home located in DeKalb County with nearby schools including Browns Mill Elementary School, Salem Middle School, and Martin Luther King- Jr. High School.
Ownership History
Date
Name
Owned For
Owner Type
Purchase Details
Closed on
Jun 21, 1999
Sold by
Federal National Mortgage Association
Bought by
Sealy Lynton
Current Estimated Value
Home Financials for this Owner
Home Financials are based on the most recent Mortgage that was taken out on this home.
Original Mortgage
$120,750
Outstanding Balance
$32,318
Interest Rate
7.23%
Mortgage Type
New Conventional
Estimated Equity
$254,078
Purchase Details
Closed on
May 5, 1998
Sold by
Hardeman Clydie M
Bought by
Huff Marlowe
Purchase Details
Closed on
Nov 15, 1996
Sold by
Mclean Velmon
Bought by
Dillard Thalianious
Purchase Details
Closed on
Sep 26, 1979
Sold by
Dillard Thalianious
Bought by
Hardeman Clydie M and Chennault Joi D
Home Financials for this Owner
Home Financials are based on the most recent Mortgage that was taken out on this home.
Original Mortgage
$128,250
Interest Rate
7.55%
Mortgage Type
New Conventional
Create a Home Valuation Report for This Property
The Home Valuation Report is an in-depth analysis detailing your home's value as well as a comparison with similar homes in the area
Home Values in the Area
Average Home Value in this Area
Purchase History
| Date | Buyer | Sale Price | Title Company |
|---|---|---|---|
| Sealy Lynton | -- | -- | |
| Huff Marlowe | $140,000 | -- | |
| Dillard Thalianious | $135,000 | -- | |
| Mclean Velmon | $107,000 | -- | |
| Hardeman Clydie M | $135,000 | -- |
Source: Public Records
Mortgage History
| Date | Status | Borrower | Loan Amount |
|---|---|---|---|
| Open | Sealy Lynton | $120,750 | |
| Previous Owner | Hardeman Clydie M | $128,250 | |
| Closed | Huff Marlowe | -- |
Source: Public Records
Tax History Compared to Growth
Tax History
| Year | Tax Paid | Tax Assessment Tax Assessment Total Assessment is a certain percentage of the fair market value that is determined by local assessors to be the total taxable value of land and additions on the property. | Land | Improvement |
|---|---|---|---|---|
| 2025 | $3,044 | $106,120 | $16,000 | $90,120 |
| 2024 | $3,017 | $101,600 | $16,000 | $85,600 |
| 2023 | $3,017 | $98,960 | $10,000 | $88,960 |
| 2022 | $2,752 | $93,000 | $10,000 | $83,000 |
| 2021 | $2,268 | $72,040 | $10,000 | $62,040 |
| 2020 | $1,834 | $54,400 | $25,920 | $28,480 |
| 2019 | $1,947 | $58,800 | $10,000 | $48,800 |
| 2018 | $1,570 | $58,800 | $10,000 | $48,800 |
| 2017 | $1,467 | $42,840 | $10,000 | $32,840 |
| 2016 | $1,335 | $54,400 | $25,920 | $28,480 |
| 2014 | $898 | $27,240 | $25,920 | $1,320 |
Source: Public Records
Map
Nearby Homes
- 3774 Hollow Oak Ln
- 4586 High Gate Ln
- 3631 Raiders Ridge Dr
- 4590 Blue Sky Ct
- 4596 Meadow Creek Path Unit II
- 4330 Dogwood Farm Rd
- 3945 Glen Park Dr
- 3711 Meadow Vista Trail
- 4517 Meadow Vista Trace Unit 2
- 4628 Mossey Dr
- 3745 Londonderry Ct
- 4461 Dogwood Farms Dr
- 4177 Donna Way
- 4519 Mossey Dr
- 4604 Mossey Dr
- 4543 Red Tail Dr
- 3778 Berdon Ln
- 3724 Eagles Beek Cir Unit 1
- 4734 Eagles Ridge Loop
- 3721 Chiltern Ct
- 4563 Moon Valley Ln
- 4581 Moon Valley Ln
- 4589 Moon Valley Ln
- 4555 Moon Valley Ln
- 4574 Moon Valley Ln
- 3795 Spring Garden Ln
- 4564 Moon Valley Ln
- 4597 Moon Valley Ln
- 3840 Woodyhill Dr
- 3824 Woodyhill Dr
- 3848 Woodyhill Dr
- 4547 Moon Valley Ln
- 4614 Woodyhill Ct
- 3796 Hollow Oak Ln Unit 1
- 3783 Spring Garden Ln
- 4608 Woodyhill Ct
- 4620 Woodyhill Ct
- 3800 Spring Garden Ln
- 3775 Spring Garden Ln
- 4607 Moon Valley Ln