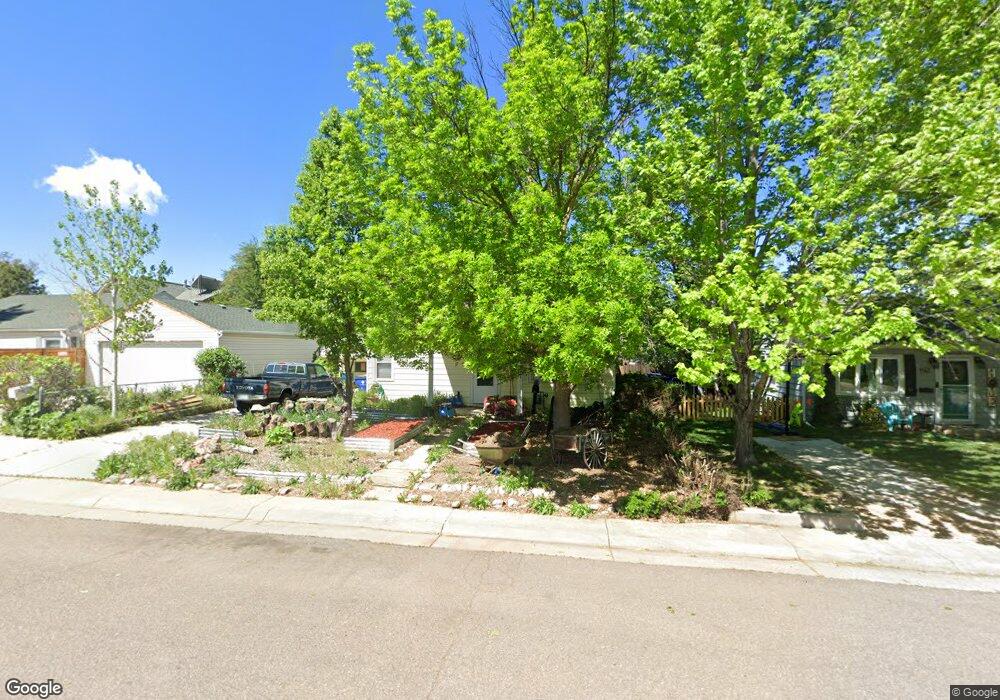
4573 S Washington St Englewood, CO 80113
Bellewood NeighborhoodEstimated Value: $466,770 - $529,000
3
Beds
1
Bath
1,152
Sq Ft
$435/Sq Ft
Est. Value
About This Home
This home is located at 4573 S Washington St, Englewood, CO 80113 and is currently estimated at $501,443, approximately $435 per square foot. 4573 S Washington St is a home located in Arapahoe County with nearby schools including Cherrelyn Elementary School, Englewood Middle School, and Englewood High School.
Ownership History
Date
Name
Owned For
Owner Type
Purchase Details
Closed on
Nov 4, 2016
Sold by
Gelinas Michael C and Gelinas Melanie
Bought by
Bartek Iona
Current Estimated Value
Home Financials for this Owner
Home Financials are based on the most recent Mortgage that was taken out on this home.
Original Mortgage
$297,440
Outstanding Balance
$238,793
Interest Rate
3.42%
Mortgage Type
FHA
Estimated Equity
$262,650
Purchase Details
Closed on
Apr 7, 2000
Sold by
Goolsby John E and Goolsby Joanne L
Bought by
Gelinas Michael C and Gelinas Melanie
Home Financials for this Owner
Home Financials are based on the most recent Mortgage that was taken out on this home.
Original Mortgage
$131,400
Interest Rate
9.8%
Purchase Details
Closed on
Oct 18, 1991
Sold by
Conversion Arapco
Bought by
Goolsby Joanne L Goolsby John E
Purchase Details
Closed on
Oct 1, 1979
Sold by
Conversion Arapco
Bought by
Conversion Arapco
Purchase Details
Closed on
Jul 4, 1776
Bought by
Conversion Arapco
Create a Home Valuation Report for This Property
The Home Valuation Report is an in-depth analysis detailing your home's value as well as a comparison with similar homes in the area
Home Values in the Area
Average Home Value in this Area
Purchase History
| Date | Buyer | Sale Price | Title Company |
|---|---|---|---|
| Bartek Iona | $303,000 | First American Title | |
| Gelinas Michael C | $133,900 | Chicago Title | |
| Goolsby Joanne L Goolsby John E | -- | -- | |
| Conversion Arapco | -- | -- | |
| Conversion Arapco | -- | -- |
Source: Public Records
Mortgage History
| Date | Status | Borrower | Loan Amount |
|---|---|---|---|
| Open | Bartek Iona | $297,440 | |
| Previous Owner | Gelinas Michael C | $131,400 |
Source: Public Records
Tax History Compared to Growth
Tax History
| Year | Tax Paid | Tax Assessment Tax Assessment Total Assessment is a certain percentage of the fair market value that is determined by local assessors to be the total taxable value of land and additions on the property. | Land | Improvement |
|---|---|---|---|---|
| 2024 | $2,121 | $30,157 | -- | -- |
| 2023 | $2,121 | $30,157 | $0 | $0 |
| 2022 | $1,793 | $24,617 | $0 | $0 |
| 2021 | $1,786 | $24,617 | $0 | $0 |
| 2020 | $1,792 | $24,396 | $0 | $0 |
| 2019 | $1,780 | $24,396 | $0 | $0 |
| 2018 | $1,641 | $20,988 | $0 | $0 |
| 2017 | $1,626 | $20,988 | $0 | $0 |
| 2016 | $1,369 | $16,732 | $0 | $0 |
| 2015 | $1,130 | $16,732 | $0 | $0 |
| 2014 | $859 | $11,797 | $0 | $0 |
| 2013 | -- | $12,280 | $0 | $0 |
Source: Public Records
Map
Nearby Homes
- 4401 S Clarkson St
- 4720 S Pennsylvania St
- 4420 S Grant St
- 4794 S Pearl St
- 4720 S Grant St
- 4680 S Sherman St
- 4703 S Sherman St
- 4291 S Clarkson St
- 4822 S Grant St
- 4893 S Sherman St
- 4728 S Acoma St
- 1515 E Tufts Ave
- 4125 S Washington St
- 4127 S Logan St
- 4588 S Cherokee St
- 4087 S Clarkson St
- 4779 S Bannock St
- 664 S Washington Cir
- 5108 S Pennsylvania St
- 4401 S Delaware St
- 4565 S Washington St
- 699 E Tufts Ave
- 669 E Tufts Ave
- 4557 S Washington St
- 4572 S Pearl St
- 4590 S Pearl St
- 4549 S Washington St
- 4564 S Pearl St
- 4556 S Pearl St
- 4596 S Pearl St
- 4574 S Washington St
- 4570 S Washington St
- 4541 S Washington St
- 4548 S Pearl St
- 4580 S Washington St
- 4601 S Washington St
- 4560 S Washington St
- 4554 S Washington St
- 4533 S Washington St
- 4600 S Pearl St