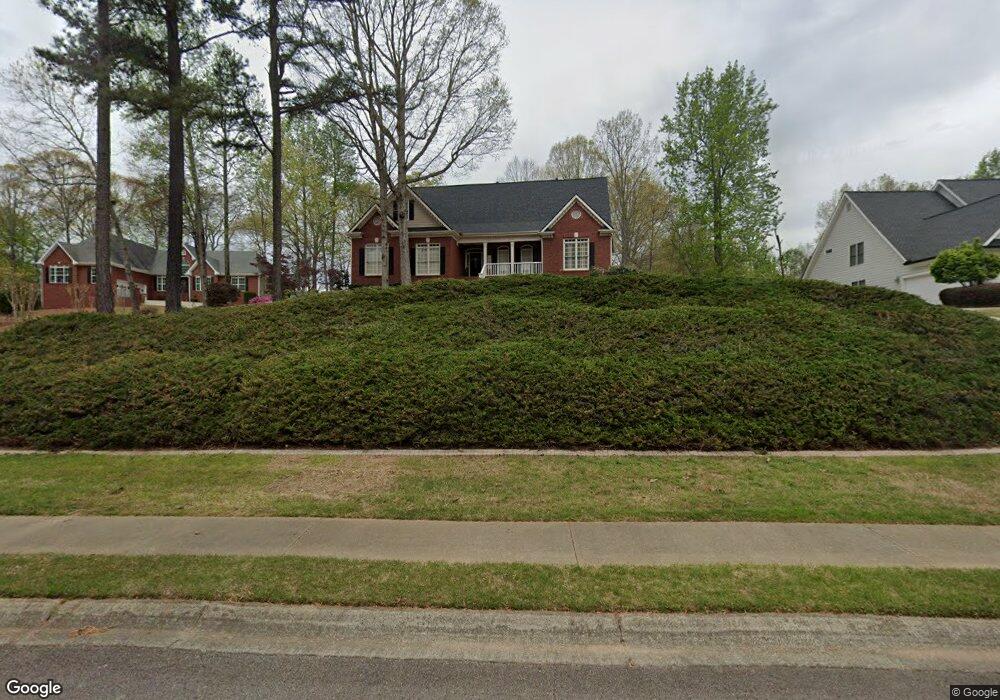
4574 Blooming Way Flowery Branch, GA 30542
Estimated Value: $554,946 - $657,000
4
Beds
3
Baths
2,962
Sq Ft
$200/Sq Ft
Est. Value
About This Home
This home is located at 4574 Blooming Way, Flowery Branch, GA 30542 and is currently estimated at $592,237, approximately $199 per square foot. 4574 Blooming Way is a home located in Hall County with nearby schools including Chestnut Mountain Elementary School, South Hall Middle School, and Johnson High School.
Ownership History
Date
Name
Owned For
Owner Type
Purchase Details
Closed on
Nov 20, 2020
Sold by
Williams Robert C
Bought by
Summerour Gregory and Summerour Kimberly
Current Estimated Value
Home Financials for this Owner
Home Financials are based on the most recent Mortgage that was taken out on this home.
Original Mortgage
$288,000
Outstanding Balance
$254,660
Interest Rate
2.8%
Mortgage Type
New Conventional
Estimated Equity
$337,577
Purchase Details
Closed on
May 31, 2002
Sold by
Josh Porter Builders Inc
Bought by
Williams Robert C and Williams Jan M
Home Financials for this Owner
Home Financials are based on the most recent Mortgage that was taken out on this home.
Original Mortgage
$100,000
Interest Rate
6.92%
Mortgage Type
New Conventional
Purchase Details
Closed on
Oct 18, 2001
Sold by
Whitmire Homes Inc
Bought by
Porter Josh Builders Inc
Purchase Details
Closed on
Nov 29, 1999
Sold by
Whitmire Tim
Bought by
Whitmire Homes Inc
Create a Home Valuation Report for This Property
The Home Valuation Report is an in-depth analysis detailing your home's value as well as a comparison with similar homes in the area
Home Values in the Area
Average Home Value in this Area
Purchase History
| Date | Buyer | Sale Price | Title Company |
|---|---|---|---|
| Summerour Gregory | $360,000 | -- | |
| Williams Robert C | $273,600 | -- | |
| Porter Josh Builders Inc | $224,000 | -- | |
| Whitmire Homes Inc | $343,000 | -- |
Source: Public Records
Mortgage History
| Date | Status | Borrower | Loan Amount |
|---|---|---|---|
| Open | Summerour Gregory | $288,000 | |
| Previous Owner | Williams Robert C | $100,000 |
Source: Public Records
Tax History Compared to Growth
Tax History
| Year | Tax Paid | Tax Assessment Tax Assessment Total Assessment is a certain percentage of the fair market value that is determined by local assessors to be the total taxable value of land and additions on the property. | Land | Improvement |
|---|---|---|---|---|
| 2024 | $5,118 | $203,120 | $13,080 | $190,040 |
| 2023 | $4,494 | $193,720 | $13,080 | $180,640 |
| 2022 | $4,209 | $157,840 | $13,080 | $144,760 |
| 2021 | $3,925 | $153,480 | $13,080 | $140,400 |
| 2020 | $4,035 | $145,920 | $13,080 | $132,840 |
| 2019 | $3,933 | $140,920 | $13,080 | $127,840 |
| 2018 | $3,895 | $135,080 | $13,080 | $122,000 |
| 2017 | $3,554 | $124,320 | $13,080 | $111,240 |
| 2016 | $2,926 | $104,320 | $13,080 | $91,240 |
| 2015 | $2,421 | $85,196 | $9,800 | $75,396 |
| 2014 | $2,421 | $85,196 | $9,800 | $75,396 |
Source: Public Records
Map
Nearby Homes
- 4643 Wilderness Trail
- 4446 Union Church Rd
- 4712 Wilderness Trail
- 4695 Wilderness Trail
- 4704 Wilderness Trail
- 4715 Wilderness Trail
- 4559 Winder Hwy
- 4577 Winder Hwy
- 4998 Planters Way
- 5055 Pointer Ridge
- 5061 Pointer Ridge
- 4621 Stanley Rd
- 5049 Holly Hock Dr
- 4835 Upper Berkshire Rd
- 4860 Wildlife Way
- 4708 Upper Berkshire Rd Unit 39
- 4743 Amsterdam Ln
- 4570 Blooming Way
- 4578 Blooming Way
- 4566 Blooming Way
- 4582 Blooming Way
- 4571 Blooming Way
- 4575 Blooming Way
- 4583 Blooming Way
- 4562 Blooming Way
- 4579 Blooming Way
- 4567 Blooming Way
- 4558 Blooming Way
- 4616 Kingswood Dr
- 4563 Blooming Way
- 4612 Kingswood Dr
- 4554 Blooming Way
- 4613 Kingswood Dr
- 4608 Kingswood Dr
- 0 Blooming Way Unit 3287976
- 0 Blooming Way Unit 8983819
- 0 Blooming Way Unit 2964668