Estimated Value: $383,000 - $406,355
4
Beds
4
Baths
2,119
Sq Ft
$185/Sq Ft
Est. Value
About This Home
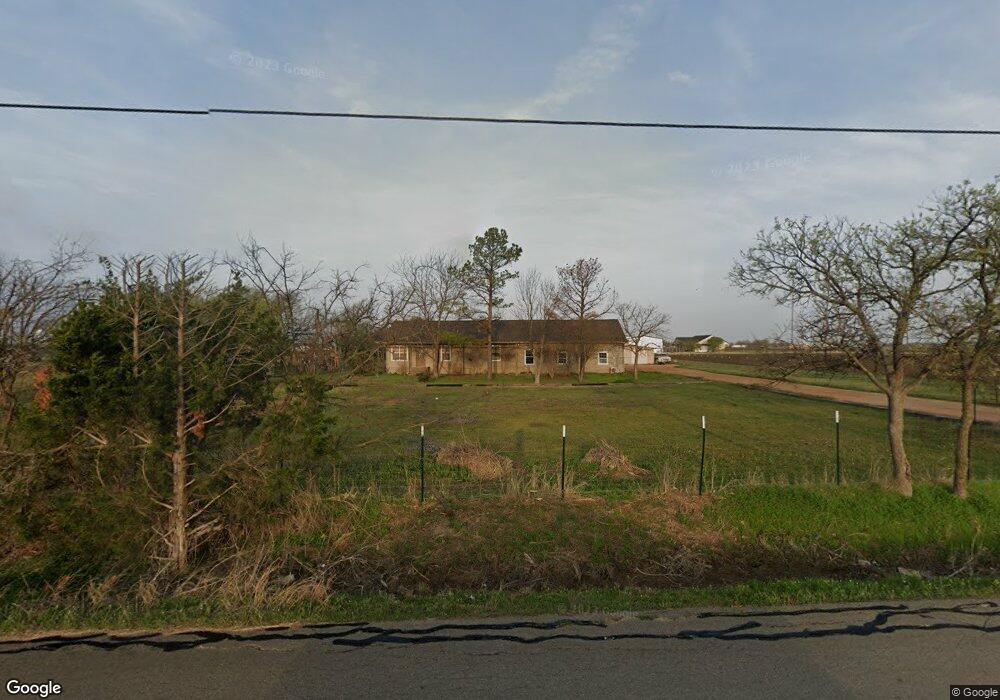
This home is located at 4575 Hopkins Rd, Krum, TX 76249 and is currently estimated at $391,589, approximately $184 per square foot. 4575 Hopkins Rd is a home located in Denton County with nearby schools including Krum Early Education Center, Blanche Dodd Intermediate School, and Krum Middle School.
Ownership History
Date
Name
Owned For
Owner Type
Purchase Details
Closed on
Aug 14, 2020
Sold by
Ferguson Leonard Douglas and Ferguson Holly Ann
Bought by
Hastie Clinton and Hastie Jennifer
Current Estimated Value
Home Financials for this Owner
Home Financials are based on the most recent Mortgage that was taken out on this home.
Original Mortgage
$259,200
Outstanding Balance
$229,929
Interest Rate
3%
Mortgage Type
New Conventional
Estimated Equity
$161,660
Purchase Details
Closed on
Jun 3, 2020
Sold by
Green Shirley N
Bought by
Ferguson Leonard Douglas
Purchase Details
Closed on
Mar 27, 2012
Sold by
Boyd Robin Latricia
Bought by
Green Shirley N
Home Financials for this Owner
Home Financials are based on the most recent Mortgage that was taken out on this home.
Original Mortgage
$147,250
Interest Rate
3.91%
Mortgage Type
New Conventional
Purchase Details
Closed on
Jan 14, 1999
Sold by
Burns James Robert
Bought by
Eiland Robin Faith
Create a Home Valuation Report for This Property
The Home Valuation Report is an in-depth analysis detailing your home's value as well as a comparison with similar homes in the area
Home Values in the Area
Average Home Value in this Area
Purchase History
| Date | Buyer | Sale Price | Title Company |
|---|---|---|---|
| Hastie Clinton | -- | Fedility National Title | |
| Ferguson Leonard Douglas | -- | None Available | |
| Green Shirley N | -- | None Available | |
| Eiland Robin Faith | -- | -- |
Source: Public Records
Mortgage History
| Date | Status | Borrower | Loan Amount |
|---|---|---|---|
| Open | Hastie Clinton | $259,200 | |
| Previous Owner | Green Shirley N | $147,250 |
Source: Public Records
Tax History Compared to Growth
Tax History
| Year | Tax Paid | Tax Assessment Tax Assessment Total Assessment is a certain percentage of the fair market value that is determined by local assessors to be the total taxable value of land and additions on the property. | Land | Improvement |
|---|---|---|---|---|
| 2025 | $1,780 | $234,266 | $196,020 | $209,393 |
| 2024 | $3,019 | $212,969 | $0 | $0 |
| 2023 | $1,511 | $193,608 | $135,000 | $152,094 |
| 2022 | $2,878 | $176,007 | $63,500 | $118,701 |
| 2021 | $2,512 | $160,006 | $40,000 | $120,006 |
| 2020 | $2,493 | $154,170 | $40,000 | $114,170 |
| 2019 | $2,809 | $159,106 | $40,000 | $119,106 |
| 2018 | $2,515 | $141,473 | $40,000 | $101,473 |
| 2017 | $2,429 | $135,836 | $40,000 | $95,836 |
| 2016 | $2,442 | $136,571 | $40,000 | $96,571 |
| 2015 | $1,988 | $121,282 | $40,000 | $81,282 |
| 2014 | $1,988 | $109,727 | $40,000 | $69,727 |
| 2013 | -- | $113,063 | $40,000 | $73,063 |
Source: Public Records
Map
Nearby Homes
- 5109 Meadow Ln
- 1600 Reed Dr
- 5213 Meadow Ln
- 5266 Meadow Ln
- 5225 Mountain View Dr
- 5254 Crystal Lake Ave
- 4140 Fm 2450
- 1500 Radecke Rd
- 124 Fm 2450
- 4107 Reese Ln
- 100 Turtle Dove
- 198 Radecke Rd
- 1216 E 6th St
- 1536 Wagon Wheel Way
- 3537 Camden Creek Rd
- 204 Cory Ct
- 3454 Eloise Ln
- 2 Finley Cir
- 6124 High Meadows Dr
- 220 Brook Cir
- 417 Leaning Tree Rd
- 417 Leaning Tree St
- 4701 Hopkins Rd
- 4650 Hopkins Rd
- 326 Leaning Tree St
- 421 Leaning Tree St
- 4293 Hopkins Rd
- 322 Leaning Tree St
- 5311 Ganzer Rd W
- 405 Leaning Tree Rd
- 405 Leaning Tree St
- 000 Fm 156 Unit 156
- 320 Leaning Tree St
- 303 Southview Ct
- 5237 Ganzer Rd W
- 5385 Fm 156 N
- 331 Leaning Tree St
- 4205 Hopkins Rd
- 5310 Ganzer Rd W
- 316 Leaning Tree St