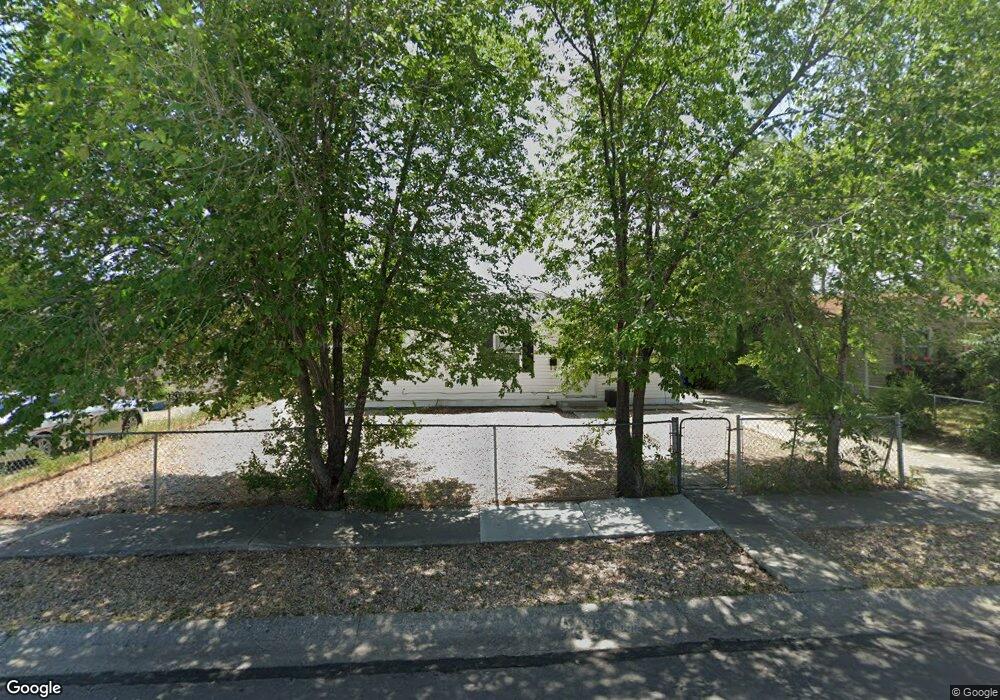
4575 W 5335 S Salt Lake City, UT 84118
Estimated Value: $354,000 - $481,000
3
Beds
1
Bath
1,390
Sq Ft
$285/Sq Ft
Est. Value
About This Home
This home is located at 4575 W 5335 S, Salt Lake City, UT 84118 and is currently estimated at $396,385, approximately $285 per square foot. 4575 W 5335 S is a home located in Salt Lake County with nearby schools including West Kearns Elementary School, Kearns Jr High School, and Kearns High School.
Ownership History
Date
Name
Owned For
Owner Type
Purchase Details
Closed on
Aug 24, 2019
Sold by
Nelson Vicky R and Jensen Lindsay M
Bought by
Nelson Vicky R
Current Estimated Value
Home Financials for this Owner
Home Financials are based on the most recent Mortgage that was taken out on this home.
Original Mortgage
$163,000
Outstanding Balance
$142,758
Interest Rate
3.7%
Mortgage Type
New Conventional
Estimated Equity
$253,627
Purchase Details
Closed on
Sep 28, 2018
Sold by
Nelson Vicky R
Bought by
Nelson Vicky R and Jensen Lindsay M
Home Financials for this Owner
Home Financials are based on the most recent Mortgage that was taken out on this home.
Original Mortgage
$140,000
Interest Rate
4.5%
Mortgage Type
New Conventional
Purchase Details
Closed on
Sep 20, 2018
Sold by
Nelson Vicky
Bought by
Nelson Vicky R
Home Financials for this Owner
Home Financials are based on the most recent Mortgage that was taken out on this home.
Original Mortgage
$140,000
Interest Rate
4.5%
Mortgage Type
New Conventional
Purchase Details
Closed on
Sep 12, 2011
Sold by
Spruce Real Estate Investments Llc
Bought by
Nelson Vicky
Purchase Details
Closed on
Jan 26, 2011
Sold by
Tollstrup Enterprises Inc
Bought by
Spruce Real Estate Investments Llc
Purchase Details
Closed on
Jan 22, 2011
Sold by
Vigil Ramiro and Vigil Della M
Bought by
Tollstrup Enterprises Inc
Purchase Details
Closed on
Feb 15, 2002
Sold by
Vigil Della M
Bought by
Vigil Ramiro and Vigil Delia M
Home Financials for this Owner
Home Financials are based on the most recent Mortgage that was taken out on this home.
Original Mortgage
$35,000
Interest Rate
6.57%
Mortgage Type
Purchase Money Mortgage
Purchase Details
Closed on
May 24, 2001
Sold by
Vigil Ramiro and Vigil Della M
Bought by
Vigil Della M
Purchase Details
Closed on
Apr 29, 1996
Sold by
Chavez Maria E and Chavez Albert J
Bought by
Vigil Ramiro and Vigil Della M
Home Financials for this Owner
Home Financials are based on the most recent Mortgage that was taken out on this home.
Original Mortgage
$80,709
Interest Rate
7.84%
Mortgage Type
FHA
Create a Home Valuation Report for This Property
The Home Valuation Report is an in-depth analysis detailing your home's value as well as a comparison with similar homes in the area
Home Values in the Area
Average Home Value in this Area
Purchase History
| Date | Buyer | Sale Price | Title Company |
|---|---|---|---|
| Nelson Vicky R | -- | Juab Title Abstract Co | |
| Nelson Vicky R | -- | Juab Title & Abstract Co | |
| Nelson Vicky R | -- | Juab Title Abstract Co | |
| Nelson Vicky | -- | Alta Title | |
| Spruce Real Estate Investments Llc | -- | Alta Title | |
| Tollstrup Enterprises Inc | $65,700 | None Available | |
| Vigil Ramiro | -- | First American Title | |
| Vigil Della M | -- | Meridian Title | |
| Vigil Ramiro | -- | -- |
Source: Public Records
Mortgage History
| Date | Status | Borrower | Loan Amount |
|---|---|---|---|
| Open | Nelson Vicky R | $163,000 | |
| Closed | Nelson Vicky R | $140,000 | |
| Previous Owner | Vigil Ramiro | $35,000 | |
| Previous Owner | Vigil Ramiro | $80,709 |
Source: Public Records
Tax History Compared to Growth
Tax History
| Year | Tax Paid | Tax Assessment Tax Assessment Total Assessment is a certain percentage of the fair market value that is determined by local assessors to be the total taxable value of land and additions on the property. | Land | Improvement |
|---|---|---|---|---|
| 2025 | $2,406 | $336,600 | $90,600 | $246,000 |
| 2024 | $2,406 | $323,900 | $86,900 | $237,000 |
| 2023 | $2,248 | $290,700 | $83,600 | $207,100 |
| 2022 | $2,089 | $277,500 | $82,000 | $195,500 |
| 2021 | $1,862 | $223,900 | $63,100 | $160,800 |
| 2020 | $1,747 | $196,300 | $54,400 | $141,900 |
| 2019 | $1,661 | $184,600 | $51,400 | $133,200 |
| 2018 | $1,798 | $167,200 | $51,400 | $115,800 |
| 2017 | $1,542 | $149,900 | $51,400 | $98,500 |
| 2016 | $1,432 | $144,200 | $51,400 | $92,800 |
| 2015 | $1,372 | $122,200 | $48,500 | $73,700 |
| 2014 | $1,206 | $117,000 | $47,000 | $70,000 |
Source: Public Records
Map
Nearby Homes