4576 Chardonnay Ct Atlanta, GA 30338
Estimated Value: $774,470 - $949,000
4
Beds
4
Baths
2,457
Sq Ft
$341/Sq Ft
Est. Value
About This Home
This home is located at 4576 Chardonnay Ct, Atlanta, GA 30338 and is currently estimated at $837,368, approximately $340 per square foot. 4576 Chardonnay Ct is a home located in DeKalb County with nearby schools including Dunwoody Elementary School, Peachtree Middle School, and Dunwoody High School.
Ownership History
Date
Name
Owned For
Owner Type
Purchase Details
Closed on
Nov 30, 2005
Sold by
Yoels Matthew E and Yoels Elana C
Bought by
Ramondino Johnny
Current Estimated Value
Home Financials for this Owner
Home Financials are based on the most recent Mortgage that was taken out on this home.
Original Mortgage
$459,600
Outstanding Balance
$249,355
Interest Rate
5.88%
Mortgage Type
New Conventional
Estimated Equity
$588,013
Purchase Details
Closed on
May 31, 2000
Sold by
Engelhard Hadley
Bought by
Yoels Matthew E and Yoels Elana C
Home Financials for this Owner
Home Financials are based on the most recent Mortgage that was taken out on this home.
Original Mortgage
$250,000
Interest Rate
8.14%
Mortgage Type
New Conventional
Purchase Details
Closed on
Mar 27, 1995
Sold by
Centex Real Est Corp
Bought by
Fosha Kent C Linda P
Create a Home Valuation Report for This Property
The Home Valuation Report is an in-depth analysis detailing your home's value as well as a comparison with similar homes in the area
Home Values in the Area
Average Home Value in this Area
Purchase History
| Date | Buyer | Sale Price | Title Company |
|---|---|---|---|
| Ramondino Johnny | $574,500 | -- | |
| Yoels Matthew E | $399,000 | -- | |
| Fosha Kent C Linda P | $275,200 | -- |
Source: Public Records
Mortgage History
| Date | Status | Borrower | Loan Amount |
|---|---|---|---|
| Open | Ramondino Johnny | $459,600 | |
| Previous Owner | Yoels Matthew E | $250,000 | |
| Closed | Fosha Kent C Linda P | $0 |
Source: Public Records
Tax History Compared to Growth
Tax History
| Year | Tax Paid | Tax Assessment Tax Assessment Total Assessment is a certain percentage of the fair market value that is determined by local assessors to be the total taxable value of land and additions on the property. | Land | Improvement |
|---|---|---|---|---|
| 2025 | $8,703 | $324,400 | $80,000 | $244,400 |
| 2024 | $7,773 | $275,400 | $80,000 | $195,400 |
| 2023 | $7,773 | $268,680 | $80,000 | $188,680 |
| 2022 | $7,310 | $255,400 | $80,000 | $175,400 |
| 2021 | $6,283 | $220,680 | $80,000 | $140,680 |
| 2020 | $6,270 | $214,240 | $80,000 | $134,240 |
| 2019 | $6,033 | $209,680 | $80,000 | $129,680 |
| 2018 | $6,147 | $200,320 | $75,200 | $125,120 |
| 2017 | $6,648 | $201,640 | $75,200 | $126,440 |
| 2016 | $6,135 | $191,800 | $75,200 | $116,600 |
| 2014 | $6,486 | $198,880 | $75,200 | $123,680 |
Source: Public Records
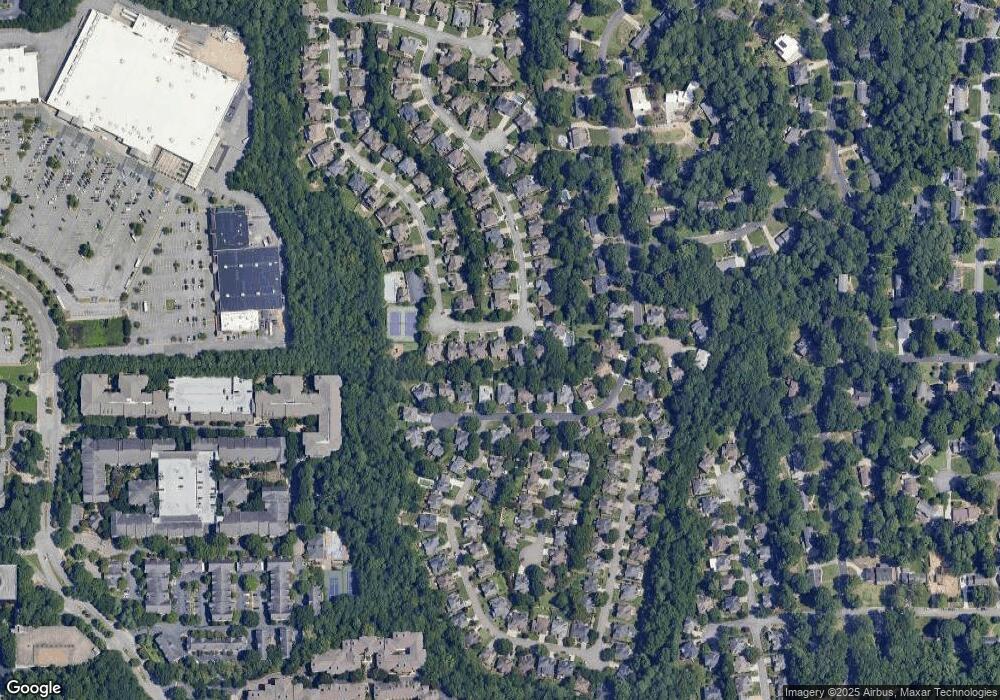
Map
Nearby Homes
- 4573 Village Springs Place
- 1490 Devonshire Ct
- 1443 Devonash Ln
- 4679 Glenshire Place
- 4648 Glenshire Place
- 11 Perimeter Center E Unit 1404
- 11 Perimeter Center E Unit 1411
- 11 Perimeter Center E Unit 1114
- 11 Perimeter Center E Unit 1203
- 11 Perimeter Center E Unit 1116
- 11 Perimeter Center E Unit 1412
- 1339 Valley View Rd
- 1460 Valley View Rd
- 4121 Townsend Ln
- 4886 Valley View Ct
- 4955 Chamblee Dunwoody Rd
- 4572 Chardonnay Ct
- 4580 Chardonnay Ct
- 4562 Devonshire Rd
- 4584 Chardonnay Ct
- 4568 Devonshire Rd
- 4567 Chardonnay Ct
- 4568 Chardonnay Ct
- 4554 Devonshire Rd
- 0 Chardonnay Ct
- 4587 Chardonnay Ct
- 4572 Devonshire Rd Unit 3
- 4564 Chardonnay Ct
- 4560 Chardonnay Ct
- 4588 Chardonnay Ct
- 4551 Chardonnay Ct
- 4578 Devonshire Rd Unit 3
- 4554 Chardonnay Ct
- 4601 Chardonnay Ct
- 4561 Devonshire Rd Unit 3
- 4567 Devonshire Rd