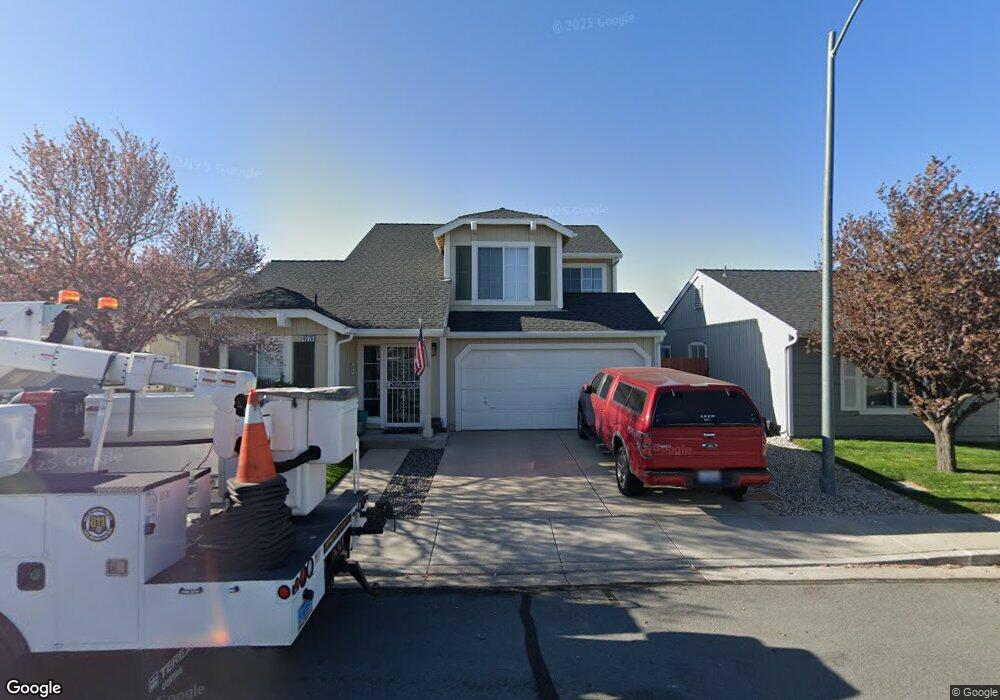
4576 Sage Rose Way Reno, NV 89502
Hidden Valley NeighborhoodEstimated Value: $477,000 - $507,000
3
Beds
3
Baths
1,456
Sq Ft
$337/Sq Ft
Est. Value
About This Home
This home is located at 4576 Sage Rose Way, Reno, NV 89502 and is currently estimated at $490,827, approximately $337 per square foot. 4576 Sage Rose Way is a home located in Washoe County with nearby schools including Hidden Valley Elementary School, Edward L Pine Middle School, and Earl Wooster High School.
Ownership History
Date
Name
Owned For
Owner Type
Purchase Details
Closed on
Mar 22, 2021
Sold by
Garcia Adrian C and Garcia Kendra
Bought by
Garcia Adrian C and Garcia Kendra
Current Estimated Value
Home Financials for this Owner
Home Financials are based on the most recent Mortgage that was taken out on this home.
Original Mortgage
$211,500
Outstanding Balance
$183,245
Interest Rate
2.73%
Mortgage Type
New Conventional
Estimated Equity
$307,582
Purchase Details
Closed on
Feb 29, 2016
Sold by
Wessel Tracy M
Bought by
Garcia Adrian C and Davis Kendra A
Home Financials for this Owner
Home Financials are based on the most recent Mortgage that was taken out on this home.
Original Mortgage
$225,834
Interest Rate
3.87%
Mortgage Type
FHA
Purchase Details
Closed on
Jun 27, 1995
Sold by
Taylor Woodrow Homes Nevada Ltd
Bought by
Wessel Tracy M
Home Financials for this Owner
Home Financials are based on the most recent Mortgage that was taken out on this home.
Original Mortgage
$99,900
Interest Rate
7.88%
Create a Home Valuation Report for This Property
The Home Valuation Report is an in-depth analysis detailing your home's value as well as a comparison with similar homes in the area
Home Values in the Area
Average Home Value in this Area
Purchase History
| Date | Buyer | Sale Price | Title Company |
|---|---|---|---|
| Garcia Adrian C | -- | First American Title Sparks | |
| Garcia Adrian C | $230,000 | Ticor Title | |
| Wessel Tracy M | $125,000 | First Centennial Title Co |
Source: Public Records
Mortgage History
| Date | Status | Borrower | Loan Amount |
|---|---|---|---|
| Open | Garcia Adrian C | $211,500 | |
| Closed | Garcia Adrian C | $225,834 | |
| Previous Owner | Wessel Tracy M | $99,900 |
Source: Public Records
Tax History Compared to Growth
Tax History
| Year | Tax Paid | Tax Assessment Tax Assessment Total Assessment is a certain percentage of the fair market value that is determined by local assessors to be the total taxable value of land and additions on the property. | Land | Improvement |
|---|---|---|---|---|
| 2025 | $2,123 | $82,688 | $35,560 | $47,128 |
| 2024 | $2,123 | $79,639 | $31,885 | $47,754 |
| 2023 | $2,062 | $78,079 | $32,655 | $45,424 |
| 2022 | $2,002 | $63,887 | $25,830 | $38,057 |
| 2021 | $2,007 | $57,103 | $19,075 | $38,028 |
| 2020 | $1,885 | $57,183 | $18,935 | $38,248 |
| 2019 | $1,796 | $54,875 | $17,815 | $37,060 |
| 2018 | $1,714 | $49,471 | $13,055 | $36,416 |
| 2017 | $1,645 | $48,731 | $12,145 | $36,586 |
| 2016 | $1,604 | $47,263 | $9,765 | $37,498 |
| 2015 | $1,601 | $45,925 | $8,365 | $37,560 |
| 2014 | $1,554 | $43,874 | $7,735 | $36,139 |
| 2013 | -- | $41,117 | $5,390 | $35,727 |
Source: Public Records
Map
Nearby Homes
- 4537 Park Rose Cir
- 3040 Chavez Dr
- 3105 Fairwood Dr
- 2942 Caballo Dr
- 3518 Herons Cir
- 4405 Primavera Ave
- 3069 Creekwood Dr
- 3020 Cisco Way
- 3534 Heron's Cir
- 2719 Chavez Dr
- 4315 Primavera Ave
- 4205 Santa Maria Dr
- 3170 Santa Ana Dr
- 2915 Fairwood Dr
- 4225 Mira Loma Dr
- 5279 Mira Loma Dr
- 5329 Mira Loma Dr
- 4160 Mira Loma Dr Unit 2B
- 3095 Randolph Dr
- 4465 Boca Way Unit 36
- 4572 Sage Rose Way
- 4582 Sage Rose Way
- 4531 China Rose Cir
- 4527 China Rose Cir
- 4527 China Rose Cir Unit Circle
- 4535 China Rose Cir
- 4568 Sage Rose Way
- 4588 Sage Rose Way
- 3102 May Rose Cir
- 4523 China Rose Cir
- 4539 China Rose Cir
- 3160 May Rose Cir
- 3101 May Rose Cir
- 4564 Sage Rose Way
- 4594 Sage Rose Way
- 4519 China Rose Cir
- 3106 May Rose Cir
- 4528 China Rose Cir
- 4532 China Rose Cir
- 3151 Winter Rose Cir