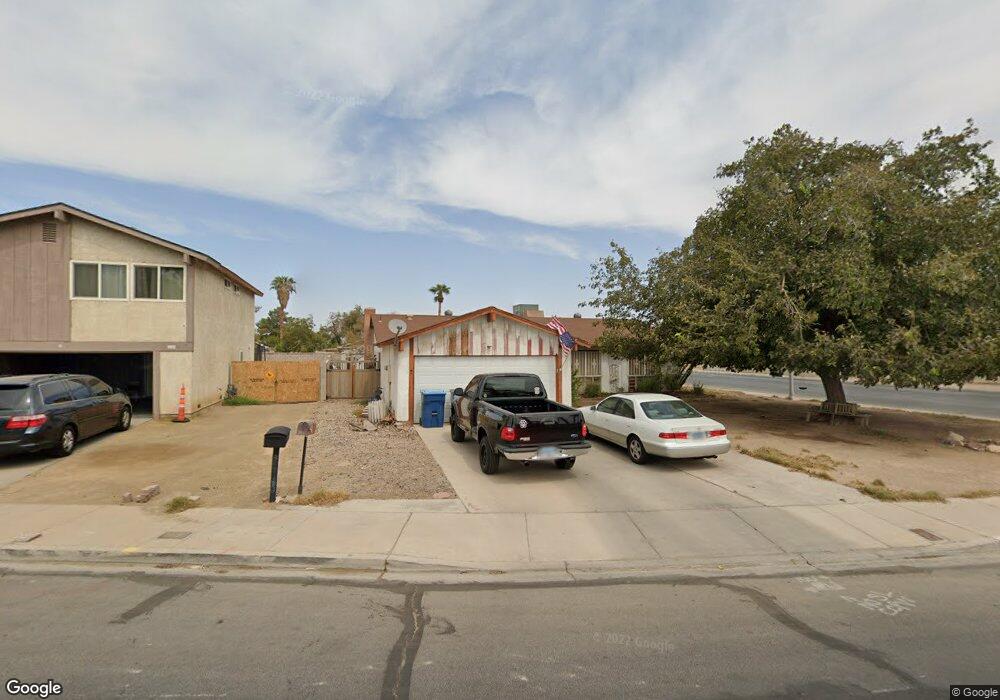
4576 Skyview Dr Las Vegas, NV 89104
Estimated Value: $347,848 - $390,000
4
Beds
2
Baths
1,408
Sq Ft
$268/Sq Ft
Est. Value
About This Home
This home is located at 4576 Skyview Dr, Las Vegas, NV 89104 and is currently estimated at $377,462, approximately $268 per square foot. 4576 Skyview Dr is a home located in Clark County with nearby schools including William E. Snyder Elementary School, Jerome Mack Middle School, and Chaparral High School.
Ownership History
Date
Name
Owned For
Owner Type
Purchase Details
Closed on
Oct 8, 2016
Sold by
Wilson Shirley K and Wilson Kenneth
Bought by
Wilson Shirley K
Current Estimated Value
Purchase Details
Closed on
May 1, 1998
Sold by
Ocwen Federal Bank Fsb
Bought by
Wilson Shirley Kaye and Wilson Kenneth
Home Financials for this Owner
Home Financials are based on the most recent Mortgage that was taken out on this home.
Original Mortgage
$78,000
Outstanding Balance
$19,144
Interest Rate
9.99%
Mortgage Type
Balloon
Estimated Equity
$358,318
Purchase Details
Closed on
Oct 2, 1997
Sold by
Steven J Melmet Inc
Bought by
Ocwen Federal Bank Fsb and Berkeley Federal Bank & Trust
Purchase Details
Closed on
Nov 10, 1993
Sold by
Quedding Maria Theresa V
Bought by
Mulcaney Flordeliz L V and Quedding Maria Bigildes
Create a Home Valuation Report for This Property
The Home Valuation Report is an in-depth analysis detailing your home's value as well as a comparison with similar homes in the area
Home Values in the Area
Average Home Value in this Area
Purchase History
| Date | Buyer | Sale Price | Title Company |
|---|---|---|---|
| Wilson Shirley K | -- | None Available | |
| Wilson Shirley K | -- | None Available | |
| Wilson Shirley Kaye | $104,000 | United Title | |
| Ocwen Federal Bank Fsb | $84,075 | Nevada Title Company | |
| Mulcaney Flordeliz L V | -- | -- |
Source: Public Records
Mortgage History
| Date | Status | Borrower | Loan Amount |
|---|---|---|---|
| Open | Wilson Shirley Kaye | $78,000 | |
| Closed | Wilson Shirley Kaye | $20,800 |
Source: Public Records
Tax History Compared to Growth
Tax History
| Year | Tax Paid | Tax Assessment Tax Assessment Total Assessment is a certain percentage of the fair market value that is determined by local assessors to be the total taxable value of land and additions on the property. | Land | Improvement |
|---|---|---|---|---|
| 2025 | $1,015 | $52,109 | $30,030 | $22,079 |
| 2024 | $968 | $52,109 | $30,030 | $22,079 |
| 2023 | $968 | $54,828 | $32,725 | $22,103 |
| 2022 | $871 | $47,584 | $26,950 | $20,634 |
| 2021 | $1,331 | $43,213 | $23,100 | $20,113 |
| 2020 | $747 | $43,133 | $22,715 | $20,418 |
| 2019 | $700 | $41,726 | $21,175 | $20,551 |
| 2018 | $668 | $37,376 | $17,325 | $20,051 |
| 2017 | $1,098 | $37,440 | $16,800 | $20,640 |
| 2016 | $878 | $33,687 | $12,180 | $21,507 |
| 2015 | $876 | $28,888 | $9,240 | $19,648 |
| 2014 | $858 | $22,673 | $6,720 | $15,953 |
Source: Public Records
Map
Nearby Homes
- 1761 Arden St
- 1485 Arden St
- 4496 Skyview Dr
- 4458 Skyview Dr
- 4746 Yuma Ave
- 4590 E Saint Louis Ave
- 4410 E Boston Ave
- 4906 E Chicago Ave
- 4324 E Saint Louis Ave
- 4709 Mahogany Dr
- 11 Page St
- 4939 Yuma Ave
- 4928 E Philadelphia Ave
- 4510 E Cleveland Ave
- 1892 Miner Way
- 1405 S Nellis Blvd Unit 1121
- 1405 S Nellis Blvd Unit 1008
- 1405 S Nellis Blvd Unit 2082
- 1405 S Nellis Blvd Unit 2117
- 1405 S Nellis Blvd Unit 2087
- 4564 Skyview Dr
- 1601 Arden St
- 4554 Skyview Dr
- 1585 Arden St
- 1733 Arden St
- 4614 E Utah Ave
- 4559 Park View Dr
- 1732 Lucky St
- 4615 Mohave Ave
- 4544 Skyview Dr
- 1569 Arden St Unit o
- 1569 Arden St
- 1570 Lucky St
- 1743 Arden St
- 4611 E Utah Ave
- 1742 Lucky St
- 4551 Park View Dr
- 4534 Skyview Dr
- 4610 Mohave Ave
- 4626 E Utah Ave