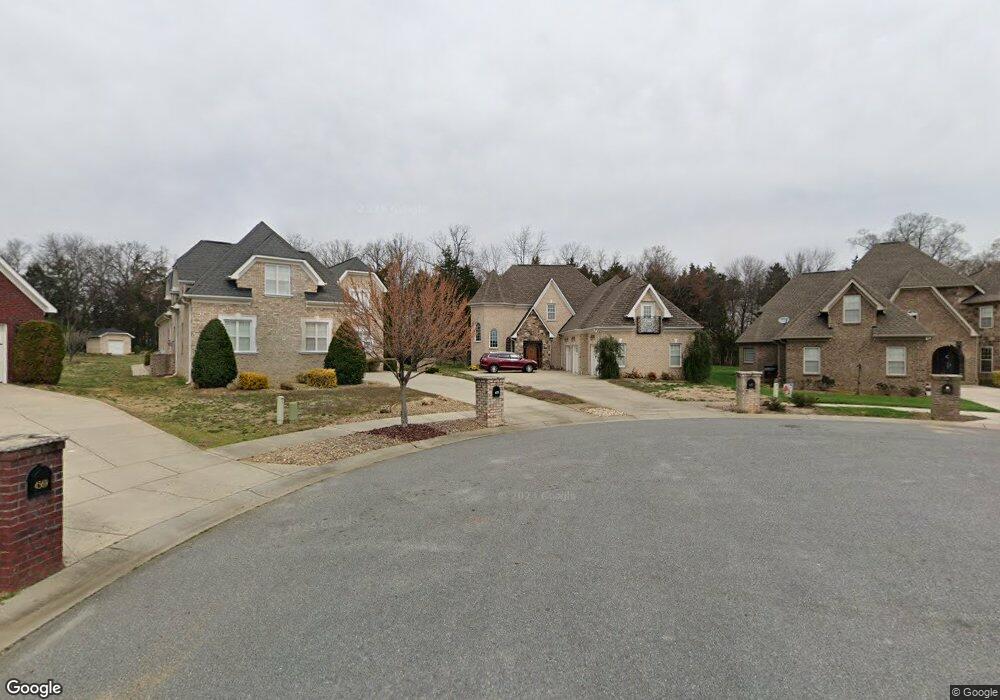
4577 Lanstone Ct SW Concord, NC 28027
Estimated Value: $649,000 - $688,000
4
Beds
5
Baths
3,828
Sq Ft
$175/Sq Ft
Est. Value
About This Home
This home is located at 4577 Lanstone Ct SW, Concord, NC 28027 and is currently estimated at $668,866, approximately $174 per square foot. 4577 Lanstone Ct SW is a home located in Cabarrus County with nearby schools including Pitts School Road Elementary School, Roberta Road Middle School, and Jay M. Robinson High School.
Ownership History
Date
Name
Owned For
Owner Type
Purchase Details
Closed on
Aug 9, 2018
Sold by
Smith Cecil O and Smith Deborah Lynn
Bought by
Bellendir Vincent Gerard and Bellendir Carol Ehlers
Current Estimated Value
Home Financials for this Owner
Home Financials are based on the most recent Mortgage that was taken out on this home.
Original Mortgage
$177,000
Outstanding Balance
$153,717
Interest Rate
4.5%
Mortgage Type
New Conventional
Estimated Equity
$515,149
Purchase Details
Closed on
May 23, 2008
Sold by
Clemio Enterprises Inc
Bought by
Smith Cecil O and Smith Deborah Lynn
Home Financials for this Owner
Home Financials are based on the most recent Mortgage that was taken out on this home.
Original Mortgage
$409,925
Interest Rate
5.84%
Mortgage Type
Purchase Money Mortgage
Create a Home Valuation Report for This Property
The Home Valuation Report is an in-depth analysis detailing your home's value as well as a comparison with similar homes in the area
Home Values in the Area
Average Home Value in this Area
Purchase History
| Date | Buyer | Sale Price | Title Company |
|---|---|---|---|
| Bellendir Vincent Gerard | $406,000 | None Available | |
| Smith Cecil O | $431,000 | None Available |
Source: Public Records
Mortgage History
| Date | Status | Borrower | Loan Amount |
|---|---|---|---|
| Open | Bellendir Vincent Gerard | $177,000 | |
| Previous Owner | Smith Cecil O | $409,925 |
Source: Public Records
Tax History Compared to Growth
Tax History
| Year | Tax Paid | Tax Assessment Tax Assessment Total Assessment is a certain percentage of the fair market value that is determined by local assessors to be the total taxable value of land and additions on the property. | Land | Improvement |
|---|---|---|---|---|
| 2025 | $6,289 | $631,440 | $110,000 | $521,440 |
| 2024 | $6,289 | $631,440 | $110,000 | $521,440 |
| 2023 | $4,949 | $405,650 | $50,000 | $355,650 |
| 2022 | $4,949 | $405,650 | $50,000 | $355,650 |
| 2021 | $4,949 | $405,650 | $50,000 | $355,650 |
| 2020 | $4,949 | $405,650 | $50,000 | $355,650 |
| 2019 | $4,505 | $369,230 | $38,000 | $331,230 |
| 2018 | $4,431 | $369,230 | $38,000 | $331,230 |
| 2017 | $4,357 | $369,230 | $38,000 | $331,230 |
| 2016 | $2,585 | $397,100 | $45,000 | $352,100 |
| 2015 | $4,686 | $397,100 | $45,000 | $352,100 |
| 2014 | $4,686 | $397,100 | $45,000 | $352,100 |
Source: Public Records
Map
Nearby Homes
- 706 King Fredrick Ln SW
- 4114 Carolina Pointe Ct SW
- 4112 Alexis Ct SW
- 3878 Longwood Dr SW
- 4271 Millet St SW Unit 198
- 4266 Barley St SW
- 5366 Hardister Place
- 4333 Glen Eagles Ln SW
- 4349 Roberta Rd
- 842 Treva Anne Dr SW
- 849 Treva Anne Dr SW
- 5361 Brickyard Terrace Ct
- 4370 Coddle Creek Dr
- 3455 Roberta Rd
- 3811 Bent Creek Dr SW
- 3254 Hawick Commons Dr
- 3709 Bentley Place SW
- 3807 Bent Creek Dr SW
- 3907 Melissa Dr
- 3369 Roberta Rd
- 4574 Lanstone Ct SW
- 4573 Lanstone Ct SW
- 4573 Lanstone Ct SW Unit 23
- 4569 Lanstone Ct SW
- 4570 Lanstone Ct SW
- 4565 Lanstone Ct SW
- 4566 Lanstone Ct SW
- 4562 Lanstone Ct SW
- 4561 Lanstone Ct SW
- 4561 Lanstone Ct SW Unit 20
- 4111 Wrangler Dr SW
- 720 King Fredrick Ln SW
- 4559 Cochran Farm Rd SW
- 716 King Fredrick Ln SW
- 4557 Lanstone Ct SW Unit Lot 19
- 4557 Lanstone Ct SW
- 4558 Lanstone Ct SW
- 4563 Cochran Farm Rd SW Unit 11
- 724 King Fredrick Ln SW
- 708 King Fredrick Ln SW