Estimated Value: $623,000 - $698,000
4
Beds
3
Baths
3,694
Sq Ft
$180/Sq Ft
Est. Value
About This Home
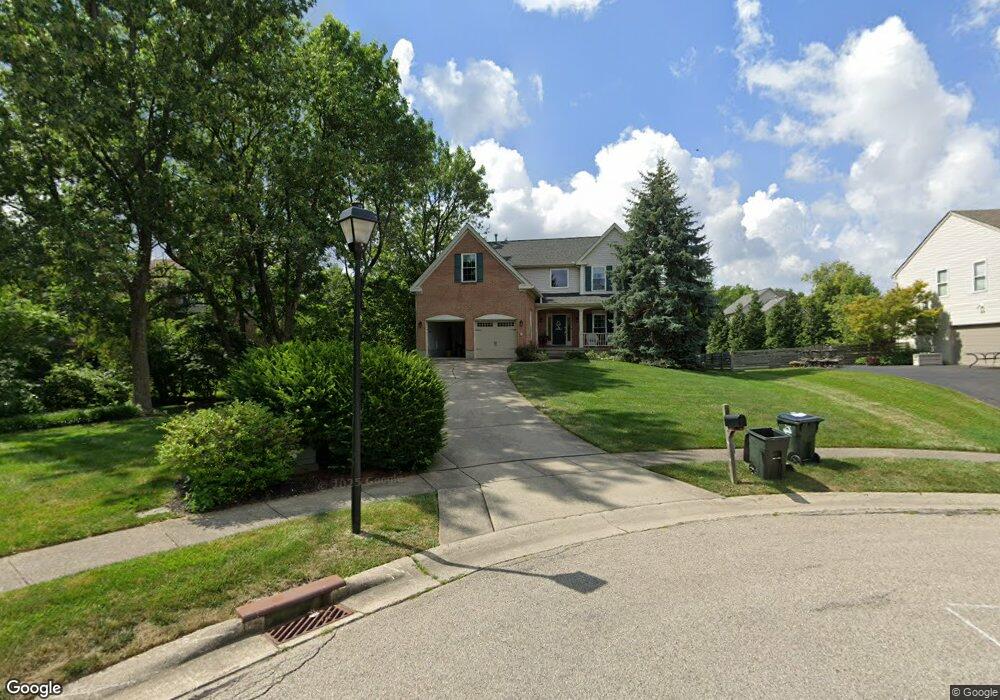
This home is located at 4579 Cobblestone Ct, Mason, OH 45040 and is currently estimated at $664,966, approximately $180 per square foot. 4579 Cobblestone Ct is a home located in Warren County with nearby schools including Mason Intermediate Elementary School, Mason Middle School, and William Mason High School.
Ownership History
Date
Name
Owned For
Owner Type
Purchase Details
Closed on
Aug 3, 2022
Sold by
Schumm Michelle L and Schumm Jeremiah A
Bought by
Schumm Family Trust
Current Estimated Value
Purchase Details
Closed on
Jun 28, 2008
Sold by
Trapp Michael K and Trapp Karen F
Bought by
Schumm Michelle L and Schumm Jeremiah A
Home Financials for this Owner
Home Financials are based on the most recent Mortgage that was taken out on this home.
Original Mortgage
$301,150
Interest Rate
5.96%
Mortgage Type
Purchase Money Mortgage
Purchase Details
Closed on
Aug 11, 1998
Sold by
D R Horton Inc
Bought by
Trapp Michael K and Trapp Karen F
Home Financials for this Owner
Home Financials are based on the most recent Mortgage that was taken out on this home.
Original Mortgage
$168,000
Interest Rate
7.05%
Mortgage Type
New Conventional
Purchase Details
Closed on
Aug 4, 1997
Sold by
Neal and Parrott
Bought by
D R Horton Inc
Create a Home Valuation Report for This Property
The Home Valuation Report is an in-depth analysis detailing your home's value as well as a comparison with similar homes in the area
Home Values in the Area
Average Home Value in this Area
Purchase History
| Date | Buyer | Sale Price | Title Company |
|---|---|---|---|
| Schumm Family Trust | -- | None Listed On Document | |
| Schumm Michelle L | $317,000 | Associates Land Title | |
| Trapp Michael K | $227,900 | -- | |
| D R Horton Inc | $160,000 | -- |
Source: Public Records
Mortgage History
| Date | Status | Borrower | Loan Amount |
|---|---|---|---|
| Previous Owner | Schumm Michelle L | $301,150 | |
| Previous Owner | Trapp Michael K | $168,000 |
Source: Public Records
Tax History Compared to Growth
Tax History
| Year | Tax Paid | Tax Assessment Tax Assessment Total Assessment is a certain percentage of the fair market value that is determined by local assessors to be the total taxable value of land and additions on the property. | Land | Improvement |
|---|---|---|---|---|
| 2024 | $7,129 | $175,670 | $38,500 | $137,170 |
| 2023 | $6,141 | $127,841 | $19,250 | $108,591 |
| 2022 | $6,062 | $127,841 | $19,250 | $108,591 |
| 2021 | $5,743 | $127,841 | $19,250 | $108,591 |
| 2020 | $6,089 | $116,218 | $17,500 | $98,718 |
| 2019 | $5,598 | $116,218 | $17,500 | $98,718 |
| 2018 | $5,616 | $116,218 | $17,500 | $98,718 |
| 2017 | $5,344 | $103,243 | $17,504 | $85,740 |
| 2016 | $5,505 | $103,243 | $17,504 | $85,740 |
| 2015 | $5,516 | $103,243 | $17,504 | $85,740 |
| 2014 | $5,282 | $92,180 | $15,630 | $76,550 |
| 2013 | $5,294 | $103,230 | $17,500 | $85,730 |
Source: Public Records
Map
Nearby Homes
- 4762 Flagstone Dr
- 6545 Farmbrooke Ct
- 6551 Farmbrooke Ct
- 6550 Villagefield Dr
- 4109 Old Manchester Ct
- 6303 Greenwood Ct
- 6292 Greenwood Ct
- 6334 Greenwood Ct
- 6279 Greenwood Ct
- 6346 Coverage Ct
- 6350 Coverage Ct
- 6342 Coverage Ct
- 6338 Coverage Ct
- 6557 Foxfield Dr
- 4427 Towneside Ct
- 6674 Villager Place Unit 153D
- 6788 Summer Field Dr
- 6546 S Mason Montgomery Rd
- 6668 Pondfield Ln
- 6768 Pondfield Ln Unit 271E
- 4670 Flagstone Dr
- 4660 Weatherstone Ct
- 4654 Weatherstone Ct
- 4680 Flagstone Dr
- 4613 Cobblestone Ct
- 6361 Killerney Ct
- 4584 Cobblestone Ct
- 6371 Killerney Ct
- 4600 Cobblestone Ct
- 4578 Cobblestone Ct
- 4686 Flagstone Dr
- 6298 Fieldstone Dr
- 6322 Fieldstone Dr
- 4698 Flagstone Dr
- 6381 Killerney Ct
- 4618 Cobblestone Ct
- 4659 Weatherstone Ct
- 43 Cobblestone Ct
- 6352 Killerney Ct
- 6395 Killerney Ct