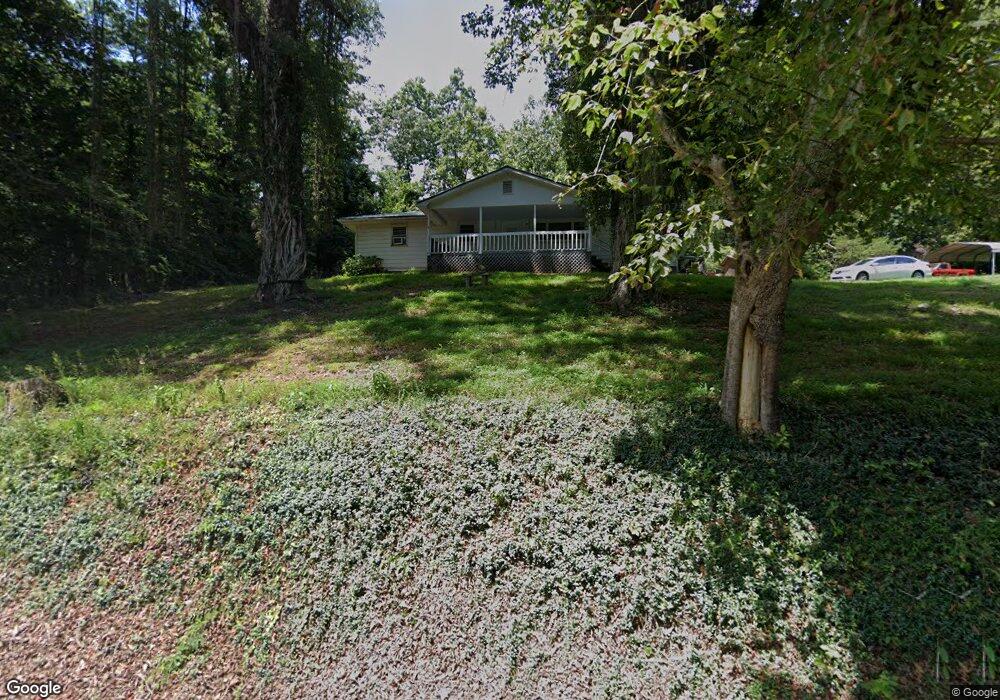
458 Dalrymple Cir Ellijay, GA 30540
Estimated Value: $199,000 - $217,892
3
Beds
1
Bath
1,248
Sq Ft
$166/Sq Ft
Est. Value
About This Home
This home is located at 458 Dalrymple Cir, Ellijay, GA 30540 and is currently estimated at $206,723, approximately $165 per square foot. 458 Dalrymple Cir is a home located in Gilmer County with nearby schools including Mountain View Elementary School, Clear Creek Middle School, and Gilmer High School.
Ownership History
Date
Name
Owned For
Owner Type
Purchase Details
Closed on
Jul 10, 2020
Sold by
Fendley Shade
Bought by
Rodgers Edward L
Current Estimated Value
Home Financials for this Owner
Home Financials are based on the most recent Mortgage that was taken out on this home.
Original Mortgage
$105,050
Outstanding Balance
$93,324
Interest Rate
3.2%
Mortgage Type
New Conventional
Estimated Equity
$113,399
Purchase Details
Closed on
Sep 19, 2013
Sold by
Barclay Cheryl Jean Dalrym
Bought by
Fendley Shade and Fendley Cassie
Home Financials for this Owner
Home Financials are based on the most recent Mortgage that was taken out on this home.
Original Mortgage
$28,000
Interest Rate
4.57%
Mortgage Type
New Conventional
Purchase Details
Closed on
Apr 9, 2012
Sold by
Dalrymple Dorothy B
Bought by
Dalrymple Dorothy B and Barclay Cheryl Jean Dalrymple
Purchase Details
Closed on
Jun 5, 2000
Sold by
Dalrymple Bill O
Bought by
Dalrymple Dorothy Mary
Create a Home Valuation Report for This Property
The Home Valuation Report is an in-depth analysis detailing your home's value as well as a comparison with similar homes in the area
Home Values in the Area
Average Home Value in this Area
Purchase History
| Date | Buyer | Sale Price | Title Company |
|---|---|---|---|
| Rodgers Edward L | $104,000 | -- | |
| Fendley Shade | $35,000 | -- | |
| Dalrymple Dorothy B | -- | -- | |
| Dalrymple Dorothy Mary | -- | -- |
Source: Public Records
Mortgage History
| Date | Status | Borrower | Loan Amount |
|---|---|---|---|
| Open | Rodgers Edward L | $105,050 | |
| Previous Owner | Fendley Shade | $28,000 |
Source: Public Records
Tax History Compared to Growth
Tax History
| Year | Tax Paid | Tax Assessment Tax Assessment Total Assessment is a certain percentage of the fair market value that is determined by local assessors to be the total taxable value of land and additions on the property. | Land | Improvement |
|---|---|---|---|---|
| 2024 | $965 | $62,296 | $5,600 | $56,696 |
| 2023 | $992 | $62,016 | $5,320 | $56,696 |
| 2022 | $911 | $51,776 | $5,320 | $46,456 |
| 2021 | $756 | $38,096 | $2,480 | $35,616 |
| 2020 | $428 | $24,824 | $2,400 | $22,424 |
| 2019 | $435 | $24,628 | $2,400 | $22,228 |
| 2018 | $444 | $24,628 | $2,400 | $22,228 |
| 2017 | $394 | $19,188 | $2,400 | $16,788 |
| 2016 | $374 | $17,476 | $2,400 | $15,076 |
| 2015 | $322 | $14,960 | $2,400 | $12,560 |
| 2014 | $309 | $15,160 | $2,400 | $12,760 |
| 2013 | -- | $14,880 | $2,400 | $12,480 |
Source: Public Records
Map
Nearby Homes
- 1304 Dalrymple Cir
- 842 Craigtown Rd
- 62 Craigtown Rd
- 240 Kennedy Ln
- L 29&30 Eastside Dr
- 37 Lafayette Dr
- LOT 627 Novel Ct
- LOT 108 High River
- LOT 164R High River
- LOT 627 Novel Ct Unit 627
- 82 Thornwood Ct
- LT 60 Honeysuckle Way
- 329 Pinson Ln
- 2044 Stillwell Rd
- LT 17R Tanager Trail
- 0 High River Rd Unit 419208
- 0 Heritage Way Unit 10633723
- 0 Flat Ridge Rd Unit 10490565
- 0 Reece Mountain Rd Unit 7663580
- 10323 Grassy Mountain Rd
- 434 Dalrymple Cir
- 332 Dalrymple Cir
- 957 Dalrymple Cir
- 551 Dalrymple Cir
- 0 Dalrymple Cir Unit 113417
- 0 Dalrymple Cir Unit 7346597
- 0 Dalrymple Cir Unit 8376362
- 0 Dalrymple Cir Unit 8490420
- 0 Dalrymple Cir Unit 8194760
- 552 Dalrymple Cir
- 618 Dalrymple Cir
- 552 Dalrymple Cir
- 166 Branch Trail
- 236 Dalrymple Cir
- 171 Branch Trail
- 171 Branch Trail
- 783 Dalrymple Cir
- 29 Branch Trail
- 959 Dalrymple Cir
- 941 Dalrymple Cir