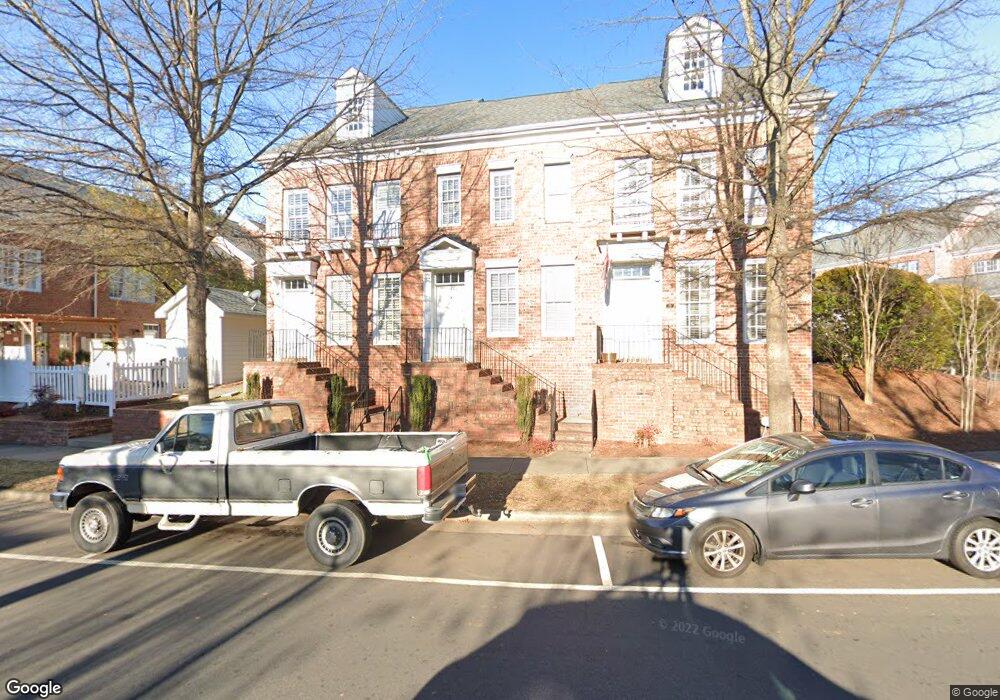
458 Davidson Gateway Dr Davidson, NC 28036
Estimated Value: $323,000 - $457,000
2
Beds
3
Baths
1,258
Sq Ft
$296/Sq Ft
Est. Value
About This Home
This home is located at 458 Davidson Gateway Dr, Davidson, NC 28036 and is currently estimated at $372,852, approximately $296 per square foot. 458 Davidson Gateway Dr is a home located in Mecklenburg County with nearby schools including Davidson Elementary School, William Amos Hough High School, and Davidson Day School.
Ownership History
Date
Name
Owned For
Owner Type
Purchase Details
Closed on
Aug 22, 2007
Sold by
Kamp Barbara Ann
Bought by
Odonnell John and Odonnell Barbara
Current Estimated Value
Home Financials for this Owner
Home Financials are based on the most recent Mortgage that was taken out on this home.
Original Mortgage
$168,000
Outstanding Balance
$106,586
Interest Rate
6.7%
Mortgage Type
Unknown
Estimated Equity
$266,266
Purchase Details
Closed on
Mar 13, 2007
Sold by
Jones Sharon R and Sherer Sharon J
Bought by
Kamp Barbara Ann
Home Financials for this Owner
Home Financials are based on the most recent Mortgage that was taken out on this home.
Original Mortgage
$139,500
Interest Rate
6.3%
Mortgage Type
Unknown
Purchase Details
Closed on
Jul 17, 2002
Sold by
Meeting Street Homes Llc
Bought by
Sherer Sharon J
Home Financials for this Owner
Home Financials are based on the most recent Mortgage that was taken out on this home.
Original Mortgage
$126,773
Interest Rate
6.67%
Mortgage Type
FHA
Create a Home Valuation Report for This Property
The Home Valuation Report is an in-depth analysis detailing your home's value as well as a comparison with similar homes in the area
Home Values in the Area
Average Home Value in this Area
Purchase History
| Date | Buyer | Sale Price | Title Company |
|---|---|---|---|
| Odonnell John | $168,000 | None Available | |
| Kamp Barbara Ann | $155,000 | None Available | |
| Sherer Sharon J | $129,000 | -- |
Source: Public Records
Mortgage History
| Date | Status | Borrower | Loan Amount |
|---|---|---|---|
| Open | Odonnell John | $168,000 | |
| Previous Owner | Kamp Barbara Ann | $139,500 | |
| Previous Owner | Sherer Sharon J | $126,773 |
Source: Public Records
Tax History
| Year | Tax Paid | Tax Assessment Tax Assessment Total Assessment is a certain percentage of the fair market value that is determined by local assessors to be the total taxable value of land and additions on the property. | Land | Improvement |
|---|---|---|---|---|
| 2025 | $2,560 | $335,100 | $100,000 | $235,100 |
| 2024 | $2,560 | $335,100 | $100,000 | $235,100 |
| 2023 | $2,521 | $335,100 | $100,000 | $235,100 |
| 2022 | $1,859 | $193,200 | $50,000 | $143,200 |
| 2021 | $1,993 | $193,200 | $50,000 | $143,200 |
| 2020 | $1,993 | $193,200 | $50,000 | $143,200 |
| 2019 | $1,987 | $193,200 | $50,000 | $143,200 |
| 2018 | $1,817 | $135,400 | $30,000 | $105,400 |
| 2017 | $1,803 | $135,400 | $30,000 | $105,400 |
| 2016 | $1,800 | $135,400 | $30,000 | $105,400 |
| 2015 | $1,796 | $135,400 | $30,000 | $105,400 |
| 2014 | $1,794 | $135,400 | $30,000 | $105,400 |
Source: Public Records
Map
Nearby Homes
- 245 Davidson Gateway Dr
- 241 Davidson Gateway Dr
- 441 Delburg Mill Aly
- 233 Davidson Gateway Dr
- 437 Delburg Mill Aly
- 229 Davidson Gateway Dr
- 409 Delburg Mill Aly
- 405 Delburg Mill Aly
- 433 Delburg Mill Aly
- 1001 Central Park Cir Unit 1001
- 413 Delburg Mill Aly
- 417 Delburg Mill Aly
- 912 Mary Max Dr
- 403 Catawba Ave
- 508 Annie Lowery Way
- 512 Annie Lowery Way
- 516 Annie Lowery Way
- 520 Annie Lowery Way
- 504 Annie Lowery Way
- 545 Annie Lowery Way
- 454 Davidson Gateway Dr
- 450 Davidson Gateway Dr
- 775 Old Meeting Way
- 767 Old Meeting Way
- 771 Old Meeting Way
- 763 Old Meeting Way
- 759 Old Meeting Way
- 759 Old Meeting Way Unit 10
- 755 Old Meeting Way
- 615 Old Meeting Way Unit 615
- 615 Old Meeting Way
- 619 Old Meeting Way
- 619 Old Meeting Way Unit 33
- 607 Old Meeting Way
- 455 Davidson Gateway Dr
- 455 Davidson Gateway Dr
- 623 Old Meeting Way
- 603 Old Meeting Way Unit 37
- 603 Old Meeting Way
- 611 Old Meeting Way
Your Personal Tour Guide
Ask me questions while you tour the home.