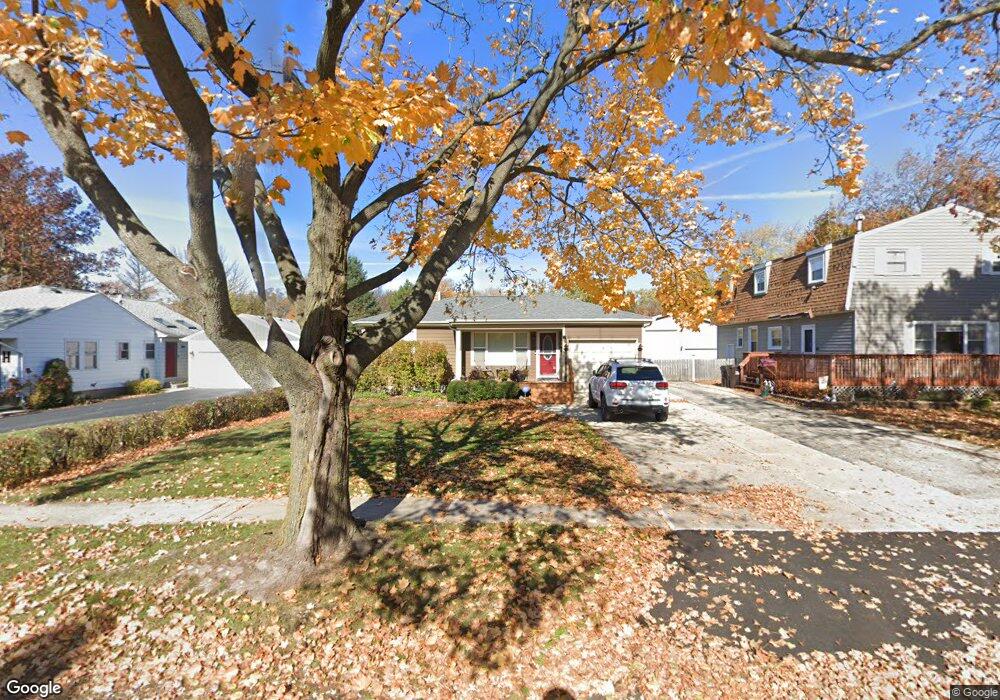
458 Golf Rd Crystal Lake, IL 60014
Estimated Value: $258,000 - $293,000
2
Beds
1
Bath
941
Sq Ft
$288/Sq Ft
Est. Value
About This Home
This home is located at 458 Golf Rd, Crystal Lake, IL 60014 and is currently estimated at $270,919, approximately $287 per square foot. 458 Golf Rd is a home located in McHenry County with nearby schools including South Elementary School, Lundahl Middle School, and Crystal Lake Central High School.
Ownership History
Date
Name
Owned For
Owner Type
Purchase Details
Closed on
Jun 3, 2011
Sold by
Coleman Clint J and Coleman Gina L
Bought by
Rojek Jeffrey D
Current Estimated Value
Home Financials for this Owner
Home Financials are based on the most recent Mortgage that was taken out on this home.
Original Mortgage
$110,135
Outstanding Balance
$76,774
Interest Rate
4.87%
Mortgage Type
FHA
Estimated Equity
$194,145
Purchase Details
Closed on
May 31, 2005
Sold by
Reter Thomas M and Reter Melissa J
Bought by
Coleman Clint J and Coleman Gina L
Home Financials for this Owner
Home Financials are based on the most recent Mortgage that was taken out on this home.
Original Mortgage
$202,150
Interest Rate
7.55%
Mortgage Type
New Conventional
Purchase Details
Closed on
Apr 9, 1996
Sold by
Fergen Larry and Brewer Irene
Bought by
Reter Thomas M and Reter Melissa J
Home Financials for this Owner
Home Financials are based on the most recent Mortgage that was taken out on this home.
Original Mortgage
$116,450
Interest Rate
7.46%
Mortgage Type
FHA
Create a Home Valuation Report for This Property
The Home Valuation Report is an in-depth analysis detailing your home's value as well as a comparison with similar homes in the area
Home Values in the Area
Average Home Value in this Area
Purchase History
| Date | Buyer | Sale Price | Title Company |
|---|---|---|---|
| Rojek Jeffrey D | $113,000 | First United Title Svcs Inc | |
| Coleman Clint J | $202,150 | Ticor | |
| Reter Thomas M | $117,900 | -- |
Source: Public Records
Mortgage History
| Date | Status | Borrower | Loan Amount |
|---|---|---|---|
| Open | Rojek Jeffrey D | $110,135 | |
| Previous Owner | Coleman Clint J | $202,150 | |
| Previous Owner | Reter Thomas M | $116,450 |
Source: Public Records
Tax History
| Year | Tax Paid | Tax Assessment Tax Assessment Total Assessment is a certain percentage of the fair market value that is determined by local assessors to be the total taxable value of land and additions on the property. | Land | Improvement |
|---|---|---|---|---|
| 2024 | $5,490 | $72,850 | $16,073 | $56,777 |
| 2023 | $5,263 | $65,155 | $14,375 | $50,780 |
| 2022 | $4,306 | $51,457 | $15,151 | $36,306 |
| 2021 | $4,050 | $47,938 | $14,115 | $33,823 |
| 2020 | $3,937 | $46,241 | $13,615 | $32,626 |
| 2019 | $3,819 | $44,258 | $13,031 | $31,227 |
| 2018 | $3,658 | $41,917 | $8,881 | $33,036 |
| 2017 | $3,615 | $39,488 | $8,366 | $31,122 |
| 2016 | $3,500 | $37,037 | $7,847 | $29,190 |
| 2013 | -- | $34,552 | $7,321 | $27,231 |
Source: Public Records
Map
Nearby Homes
- 479 Porter Ave
- 571 Nash Rd
- 635 Eletson Dr
- 627 Chardonnay Ln
- 615 Lake Ave
- 501 Coventry Ln Unit 18
- 529 Eagle St
- 530 Devonshire Ln Unit 13
- 691 Lake Ave
- 567 Cress Creek Ln
- 370 S Oriole Trail
- 207 Uteg St Unit 302
- 693 Exmoor Terrace
- 193 Lake Ct
- 490 Westwood Ct Unit D
- 381 Keith Ave
- 740 Saint Andrews Ln Unit 38
- 191 S Virginia St
- 130 S Virginia St
- 121 Pomeroy Ave
Your Personal Tour Guide
Ask me questions while you tour the home.