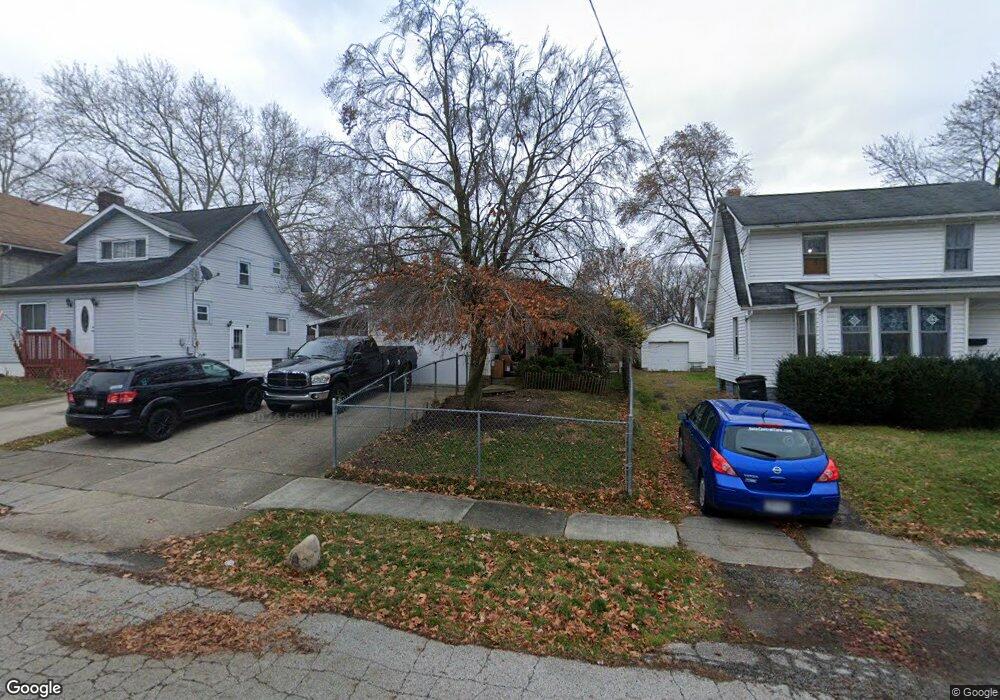
458 Lockwood St Akron, OH 44314
Kenmore NeighborhoodEstimated Value: $140,000 - $155,909
3
Beds
1
Bath
1,052
Sq Ft
$142/Sq Ft
Est. Value
About This Home
This home is located at 458 Lockwood St, Akron, OH 44314 and is currently estimated at $148,977, approximately $141 per square foot. 458 Lockwood St is a home located in Summit County with nearby schools including Sam Salem Community Learning Center.
Ownership History
Date
Name
Owned For
Owner Type
Purchase Details
Closed on
Aug 16, 2009
Sold by
Firestone Federal Credit Union
Bought by
Smith Dennis D and Woody Samantha M
Current Estimated Value
Home Financials for this Owner
Home Financials are based on the most recent Mortgage that was taken out on this home.
Original Mortgage
$70,000
Interest Rate
5.29%
Mortgage Type
Purchase Money Mortgage
Purchase Details
Closed on
Jul 3, 2008
Sold by
Kasner John E
Bought by
Firestone Fcu
Purchase Details
Closed on
Jun 5, 2003
Sold by
Kasner Mary
Bought by
Kasner John E
Home Financials for this Owner
Home Financials are based on the most recent Mortgage that was taken out on this home.
Original Mortgage
$71,000
Interest Rate
5.88%
Mortgage Type
Purchase Money Mortgage
Purchase Details
Closed on
Aug 19, 1999
Sold by
Clapton Darwin L and Fern Rhonda A
Bought by
Kasner Mary
Home Financials for this Owner
Home Financials are based on the most recent Mortgage that was taken out on this home.
Original Mortgage
$70,650
Interest Rate
7.7%
Create a Home Valuation Report for This Property
The Home Valuation Report is an in-depth analysis detailing your home's value as well as a comparison with similar homes in the area
Home Values in the Area
Average Home Value in this Area
Purchase History
| Date | Buyer | Sale Price | Title Company |
|---|---|---|---|
| Smith Dennis D | $65,000 | Attorney | |
| Firestone Fcu | $62,000 | First Security Title | |
| Kasner John E | $71,000 | -- | |
| Kasner Mary | $78,500 | -- |
Source: Public Records
Mortgage History
| Date | Status | Borrower | Loan Amount |
|---|---|---|---|
| Closed | Smith Dennis D | $70,000 | |
| Previous Owner | Kasner John E | $71,000 | |
| Previous Owner | Kasner Mary | $70,650 |
Source: Public Records
Tax History Compared to Growth
Tax History
| Year | Tax Paid | Tax Assessment Tax Assessment Total Assessment is a certain percentage of the fair market value that is determined by local assessors to be the total taxable value of land and additions on the property. | Land | Improvement |
|---|---|---|---|---|
| 2025 | $3,167 | $41,234 | $7,956 | $33,278 |
| 2024 | $2,183 | $41,234 | $7,956 | $33,278 |
| 2023 | $3,167 | $41,234 | $7,956 | $33,278 |
| 2022 | $1,789 | $26,341 | $4,851 | $21,490 |
| 2021 | $1,791 | $26,341 | $4,851 | $21,490 |
| 2020 | $1,764 | $26,340 | $4,850 | $21,490 |
| 2019 | $2,044 | $27,890 | $4,510 | $23,380 |
| 2018 | $2,017 | $27,890 | $4,510 | $23,380 |
| 2017 | $2,269 | $27,890 | $4,510 | $23,380 |
| 2016 | $2,271 | $29,810 | $4,850 | $24,960 |
| 2015 | $2,269 | $29,810 | $4,850 | $24,960 |
| 2014 | $2,252 | $29,810 | $4,850 | $24,960 |
| 2013 | $2,282 | $30,910 | $4,850 | $26,060 |
Source: Public Records
Map
Nearby Homes
- 2365 Pelton Ave
- 364 Rexford St
- 363 Lockwood St
- 355 Lockwood St
- 2531 Pelton Ave
- 451 Allenford St
- 2513 Christensen Ave
- 590 Flora Ave
- 636 Flora Ave
- 2785 Nesmith Lake Blvd
- 2303 6th St SW
- 2323 11th St SW
- 2238 7th St SW
- 2332 11th St SW
- 2199 6th St SW
- 2291 11th St SW
- 2186 5th St SW
- 55 W Ralston Ave
- 41 W Woodsdale Ave
- 75 W Dartmore Ave
- 462 Lockwood St
- 452 Lockwood St
- 448 Lockwood St
- 466 Lockwood St
- 470 Lockwood St
- 451 Rexford St
- 445 Rexford St
- 457 Rexford St
- 463 Rexford St
- 433 Rexford St
- 457 Lockwood St
- 461 Lockwood St
- 2390 Pelton Ave
- 478 Lockwood St
- 467 Rexford St
- 471 Lockwood St
- 432 Lockwood St
- 482 Lockwood St
- 475 Lockwood St
- 473 Rexford St