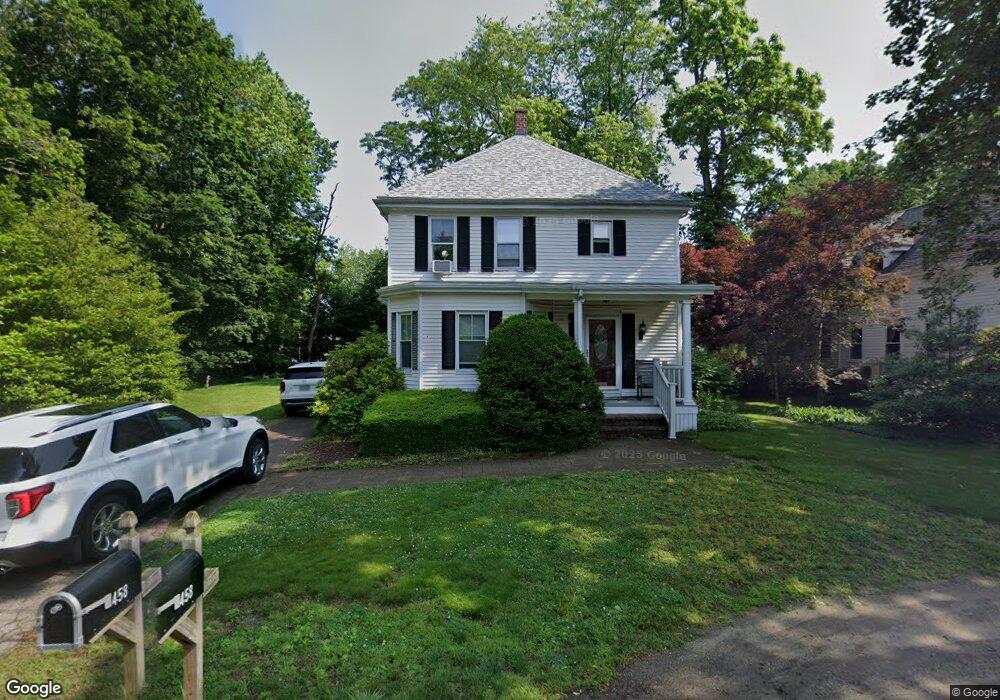
458 Matfield St West Bridgewater, MA 02379
Estimated Value: $573,564 - $662,000
3
Beds
3
Baths
2,000
Sq Ft
$310/Sq Ft
Est. Value
About This Home
This home is located at 458 Matfield St, West Bridgewater, MA 02379 and is currently estimated at $620,641, approximately $310 per square foot. 458 Matfield St is a home located in Plymouth County with nearby schools including Spring Street Elementary School, Howard Elementary School, and Rose L. MacDonald Elementary School.
Ownership History
Date
Name
Owned For
Owner Type
Purchase Details
Closed on
Nov 2, 1998
Sold by
Rendel Christopher A and Rendel Jennifer L
Bought by
Maclellan Daniel and Maclellan Pauline M
Current Estimated Value
Purchase Details
Closed on
Mar 3, 1993
Sold by
Leclair Michael A and Leclair Sharon C
Bought by
Rendel Christopher A and Harrold Jennifer L
Create a Home Valuation Report for This Property
The Home Valuation Report is an in-depth analysis detailing your home's value as well as a comparison with similar homes in the area
Home Values in the Area
Average Home Value in this Area
Purchase History
| Date | Buyer | Sale Price | Title Company |
|---|---|---|---|
| Maclellan Daniel | $173,500 | -- | |
| Rendel Christopher A | $120,000 | -- |
Source: Public Records
Mortgage History
| Date | Status | Borrower | Loan Amount |
|---|---|---|---|
| Open | Rendel Christopher A | $30,000 | |
| Open | Rendel Christopher A | $259,200 | |
| Closed | Rendel Christopher A | $236,800 |
Source: Public Records
Tax History Compared to Growth
Tax History
| Year | Tax Paid | Tax Assessment Tax Assessment Total Assessment is a certain percentage of the fair market value that is determined by local assessors to be the total taxable value of land and additions on the property. | Land | Improvement |
|---|---|---|---|---|
| 2025 | $6,395 | $467,800 | $203,700 | $264,100 |
| 2024 | $6,238 | $440,200 | $184,600 | $255,600 |
| 2023 | $5,793 | $376,900 | $159,900 | $217,000 |
| 2022 | $5,687 | $350,600 | $150,400 | $200,200 |
| 2021 | $5,539 | $331,500 | $150,400 | $181,100 |
| 2020 | $5,582 | $341,000 | $150,400 | $190,600 |
| 2019 | $5,511 | $333,400 | $150,400 | $183,000 |
| 2018 | $9,972 | $319,800 | $142,800 | $177,000 |
| 2017 | $5,330 | $300,600 | $129,400 | $171,200 |
| 2016 | $5,247 | $291,500 | $120,300 | $171,200 |
| 2015 | $5,074 | $284,900 | $120,300 | $164,600 |
| 2014 | $4,698 | $284,900 | $120,300 | $164,600 |
Source: Public Records
Map
Nearby Homes
- 462 Matfield St
- 448 Matfield St
- 448 Matfield St Unit 1
- 124 Belmont St
- 466 Matfield St
- 451 Matfield St
- 461 Matfield St Unit 463
- 127 Belmont St
- 467 Matfield St
- 470 Matfield St
- 470 Matfield St
- 471 Matfield St
- 131 Belmont St
- 474 Matfield St
- 15 Thayer Ave
- 108 Belmont St
- 00 Thayer Ave
- 101 Belmont St
- 485 Matfield St
- 17 Thayer Ave