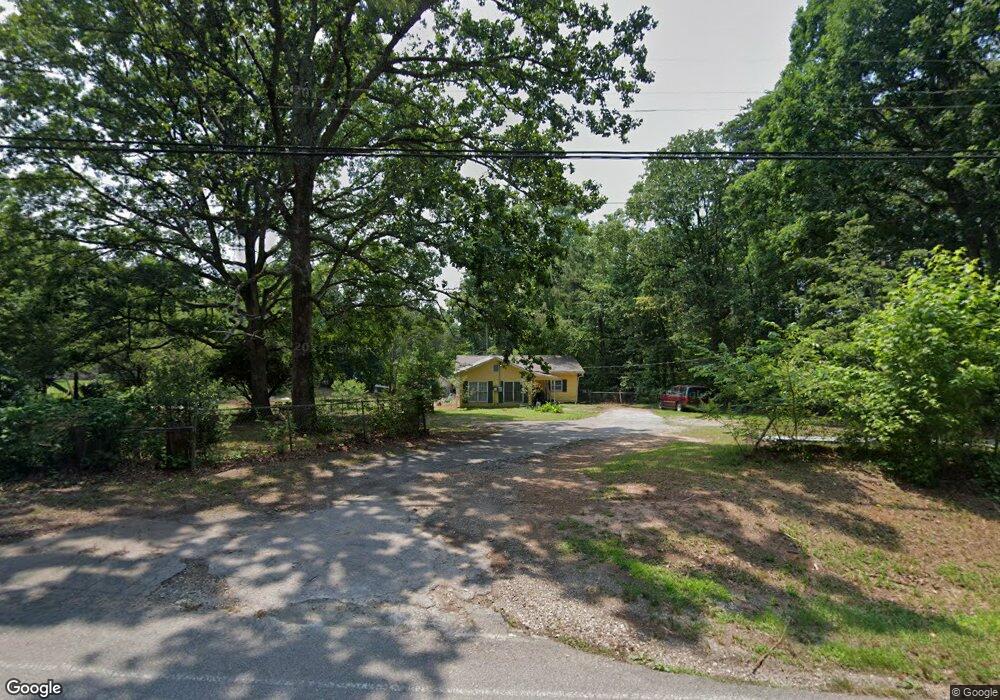
458 Thunder Rd Buford, GA 30518
Estimated Value: $269,000 - $401,000
3
Beds
1
Bath
1,005
Sq Ft
$325/Sq Ft
Est. Value
About This Home
This home is located at 458 Thunder Rd, Buford, GA 30518 and is currently estimated at $326,211, approximately $324 per square foot. 458 Thunder Rd is a home located in Hall County with nearby schools including Buford Elementary School, Buford Academy, and Buford Senior Academy.
Ownership History
Date
Name
Owned For
Owner Type
Purchase Details
Closed on
Jun 11, 2024
Sold by
Atlas Development Services Inc
Bought by
Tipton Builders Group Llc
Current Estimated Value
Purchase Details
Closed on
Jul 7, 2023
Sold by
Keithco Properties Llc
Bought by
Chattahoochee Properties Inc
Purchase Details
Closed on
Jul 17, 2020
Sold by
Sutton Mildred M
Bought by
Keithco Properties Llc
Purchase Details
Closed on
Mar 13, 2015
Sold by
Sutton William H
Bought by
Sutton Mildred M
Home Financials for this Owner
Home Financials are based on the most recent Mortgage that was taken out on this home.
Original Mortgage
$72,000
Interest Rate
3.79%
Mortgage Type
New Conventional
Purchase Details
Closed on
Feb 22, 1995
Sold by
Cantrell Linda Lorine
Bought by
Sutton William H and Sutton Ila
Purchase Details
Closed on
Feb 1, 1995
Create a Home Valuation Report for This Property
The Home Valuation Report is an in-depth analysis detailing your home's value as well as a comparison with similar homes in the area
Home Values in the Area
Average Home Value in this Area
Purchase History
| Date | Buyer | Sale Price | Title Company |
|---|---|---|---|
| Tipton Builders Group Llc | $1,300,000 | -- | |
| Atlas Development Services Inc | $285,000 | -- | |
| Chattahoochee Properties Inc | -- | -- | |
| Breedlove Cecil | $64,000 | -- | |
| Keithco Properties Llc | $125,000 | -- | |
| Sutton Mildred M | $90,000 | -- | |
| Sutton William H | $61,400 | -- | |
| -- | $61,400 | -- |
Source: Public Records
Mortgage History
| Date | Status | Borrower | Loan Amount |
|---|---|---|---|
| Previous Owner | Sutton Mildred M | $72,000 |
Source: Public Records
Tax History
| Year | Tax Paid | Tax Assessment Tax Assessment Total Assessment is a certain percentage of the fair market value that is determined by local assessors to be the total taxable value of land and additions on the property. | Land | Improvement |
|---|---|---|---|---|
| 2025 | $2,307 | $93,736 | $46,440 | $47,296 |
| 2024 | $1,881 | $73,188 | $28,960 | $44,228 |
| 2023 | $1,975 | $73,880 | $28,960 | $44,920 |
| 2022 | $1,383 | $50,840 | $20,280 | $30,560 |
| 2021 | $1,376 | $49,640 | $20,280 | $29,360 |
| 2020 | $382 | $36,480 | $14,720 | $21,760 |
| 2019 | $397 | $32,560 | $14,720 | $17,840 |
| 2018 | $393 | $32,114 | $13,360 | $18,754 |
| 2017 | $377 | $32,114 | $13,360 | $18,754 |
| 2016 | $350 | $32,114 | $13,360 | $18,754 |
| 2015 | $900 | $32,114 | $13,360 | $18,754 |
| 2014 | $900 | $32,114 | $13,360 | $18,754 |
Source: Public Records
Map
Nearby Homes
- 454 Thunder Rd
- 452 Thunder Rd
- 450 Thunder Rd
- 403 Thunder Rd
- 436 Thunder Rd
- 879 Gainesville Hwy
- 900 Gainesville Hwy
- 405 Thunder Rd
- 2999 S Waterworks Rd
- 119 Holiday Rd Unit 1202
- 406 Thunder Rd
- 0 McEver Rd Unit 10506093
- Lot 2 Thunder Rd
- Lot 3 Thunder Rd
- 3180 Lee Dr
- 5758 Hickory Wood Ln
- 5758 Hickory Wood Ln Unit 336
- 0 Peachtree Industrial Blvd Unit 7679534
- 2739 S Waterworks Rd
- 6225 Bridgewood Dr
- 456 Thunder Rd
- 405 Sweet Apple Ln Unit 1
- 405 Sweet Apple Ln
- 405 Sweet Apple Ln
- 409 Sweet Apple Ln
- 470 Thunder Rd
- 463 Thunder Rd
- 413 Sweet Apple Ln
- 404 Apple Wood Ct Unit 41
- 404 Apple Wood Ct
- 406 Sweet Apple Ln
- 417 Sweet Apple Ln
- 410 Sweet Apple Ln
- 408 Apple Wood Ct
- 421 Sweet Apple Ln
- 1005 Parkway Industrial Park Dr Unit A
- 414 Sweet Apple Ln
- 411 Apple Wood Ct
- 412 Apple Wood Ct
- 467 Thunder Rd
Your Personal Tour Guide
Ask me questions while you tour the home.