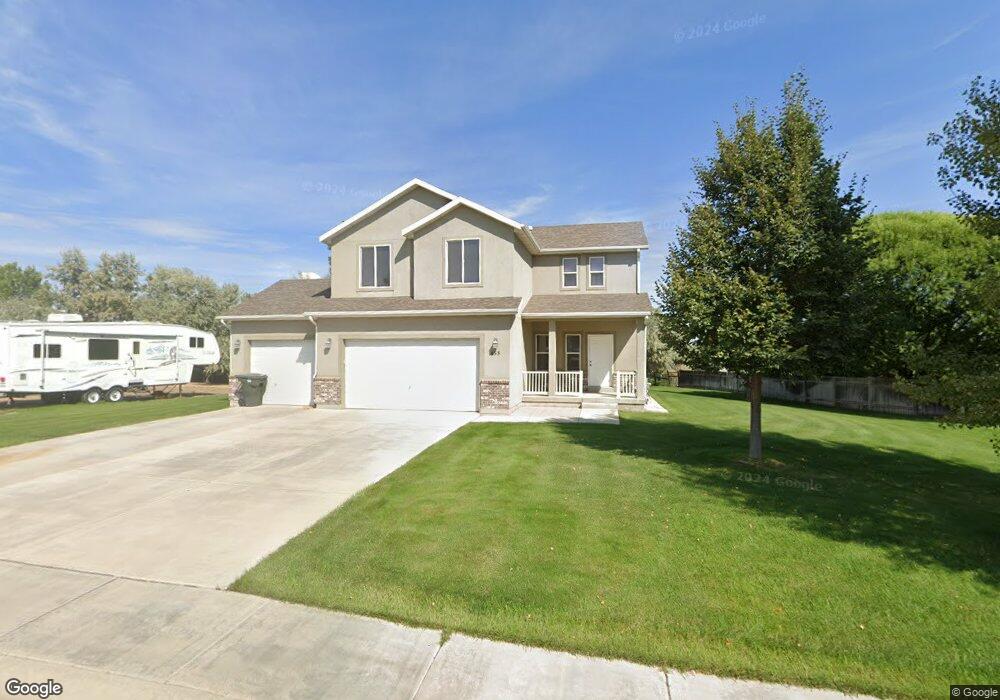
458 W 2800 S Vernal, UT 84078
Estimated Value: $376,000 - $450,000
4
Beds
3
Baths
1,649
Sq Ft
$248/Sq Ft
Est. Value
About This Home
This home is located at 458 W 2800 S, Vernal, UT 84078 and is currently estimated at $409,636, approximately $248 per square foot. 458 W 2800 S is a home located in Uintah County with nearby schools including Discovery School, Vernal Middle School, and Uintah Middle School.
Ownership History
Date
Name
Owned For
Owner Type
Purchase Details
Closed on
Dec 15, 2009
Sold by
Croghan Patrick W
Bought by
Johnson Bradley N
Current Estimated Value
Home Financials for this Owner
Home Financials are based on the most recent Mortgage that was taken out on this home.
Original Mortgage
$216,326
Outstanding Balance
$141,173
Interest Rate
4.91%
Mortgage Type
New Conventional
Estimated Equity
$268,463
Purchase Details
Closed on
Dec 30, 2007
Sold by
Holman Curt
Bought by
Croghan Patrick W
Purchase Details
Closed on
Dec 12, 2007
Sold by
Investment Opportunity Union Llc
Bought by
Holman Curt
Purchase Details
Closed on
Jun 28, 2007
Sold by
Fainacial Maverick
Bought by
Investment Opportunity Union
Home Financials for this Owner
Home Financials are based on the most recent Mortgage that was taken out on this home.
Original Mortgage
$65,000
Interest Rate
6.21%
Mortgage Type
New Conventional
Create a Home Valuation Report for This Property
The Home Valuation Report is an in-depth analysis detailing your home's value as well as a comparison with similar homes in the area
Home Values in the Area
Average Home Value in this Area
Purchase History
| Date | Buyer | Sale Price | Title Company |
|---|---|---|---|
| Johnson Bradley N | -- | -- | |
| Croghan Patrick W | -- | -- | |
| Holman Curt | -- | -- | |
| Investment Opportunity Union | -- | -- |
Source: Public Records
Mortgage History
| Date | Status | Borrower | Loan Amount |
|---|---|---|---|
| Open | Johnson Bradley N | $216,326 | |
| Previous Owner | Investment Opportunity Union | $65,000 |
Source: Public Records
Tax History Compared to Growth
Tax History
| Year | Tax Paid | Tax Assessment Tax Assessment Total Assessment is a certain percentage of the fair market value that is determined by local assessors to be the total taxable value of land and additions on the property. | Land | Improvement |
|---|---|---|---|---|
| 2024 | $1,642 | $195,399 | $19,254 | $176,145 |
| 2023 | $1,642 | $179,385 | $19,254 | $160,131 |
| 2022 | $1,521 | $147,359 | $19,254 | $128,105 |
| 2021 | $1,584 | $69,304 | $10,590 | $58,715 |
| 2020 | $1,394 | $113,854 | $19,250 | $94,604 |
| 2019 | $1,411 | $113,854 | $19,250 | $94,604 |
| 2018 | $1,353 | $109,349 | $19,250 | $90,099 |
| 2017 | $13 | $109,349 | $19,250 | $90,099 |
| 2016 | $1,263 | $112,136 | $19,250 | $92,886 |
| 2015 | $1,165 | $112,218 | $19,250 | $92,968 |
| 2014 | $1,097 | $106,956 | $19,250 | $87,706 |
| 2013 | $1,092 | $104,206 | $16,500 | $87,706 |
Source: Public Records
Map
Nearby Homes