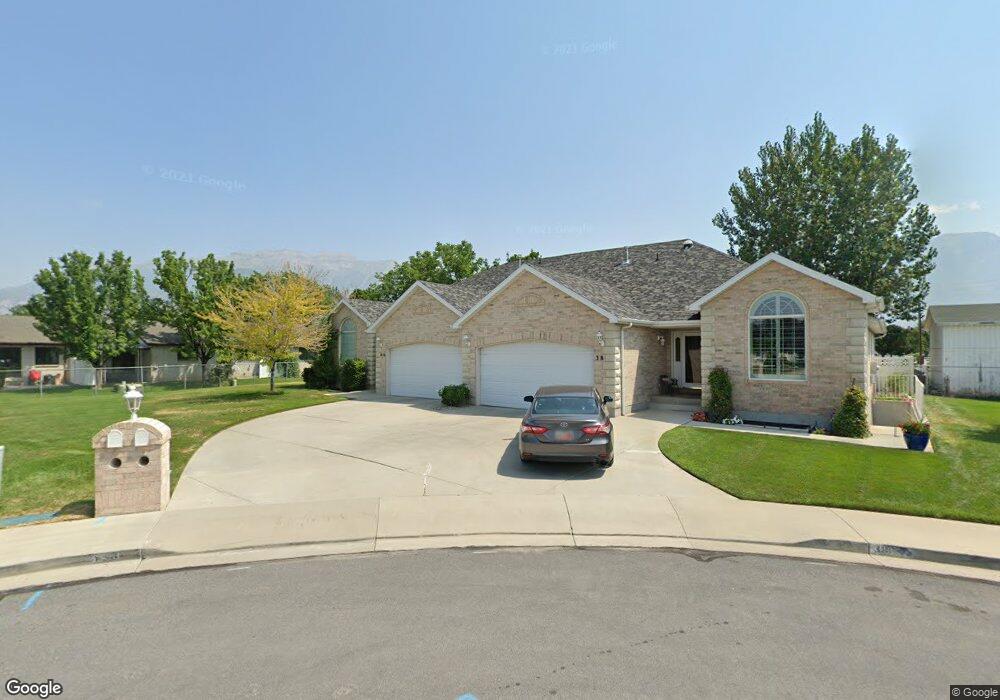
458 W 40 N Unit 11 B Orem, UT 84057
Suncrest NeighborhoodEstimated Value: $522,000 - $549,000
2
Beds
2
Baths
2,800
Sq Ft
$190/Sq Ft
Est. Value
About This Home
This home is located at 458 W 40 N Unit 11 B, Orem, UT 84057 and is currently estimated at $531,219, approximately $189 per square foot. 458 W 40 N Unit 11 B is a home located in Utah County with nearby schools including Parkside Elementary School, Orem Junior High School, and Mountain View High School.
Ownership History
Date
Name
Owned For
Owner Type
Purchase Details
Closed on
Mar 30, 2010
Sold by
Folsom Richard L
Bought by
Folsom Yukiko
Current Estimated Value
Purchase Details
Closed on
Jan 13, 2009
Sold by
Budge Capital Company Llc
Bought by
Folsom Richard L and Folsom Yukiko
Purchase Details
Closed on
Aug 11, 2004
Sold by
Powell Jordan C and Powell Cindy L
Bought by
Budge Capital Co Llc
Purchase Details
Closed on
Nov 5, 1998
Sold by
Adm Development Lc
Bought by
Powell Jordan C and Powell Cindy L
Create a Home Valuation Report for This Property
The Home Valuation Report is an in-depth analysis detailing your home's value as well as a comparison with similar homes in the area
Home Values in the Area
Average Home Value in this Area
Purchase History
| Date | Buyer | Sale Price | Title Company |
|---|---|---|---|
| Folsom Yukiko | -- | Action Title Company | |
| Folsom Richard L | -- | Action Title Company | |
| Budge Capital Co Llc | $238,000 | -- | |
| Powell Jordan C | -- | Mountain West Title Co |
Source: Public Records
Tax History Compared to Growth
Tax History
| Year | Tax Paid | Tax Assessment Tax Assessment Total Assessment is a certain percentage of the fair market value that is determined by local assessors to be the total taxable value of land and additions on the property. | Land | Improvement |
|---|---|---|---|---|
| 2025 | $2,320 | $282,645 | $101,800 | $412,100 |
| 2024 | $2,158 | $283,635 | $0 | $0 |
| 2023 | $2,158 | $283,580 | $0 | $0 |
| 2022 | $2,119 | $269,830 | $0 | $0 |
| 2021 | $1,927 | $371,700 | $86,100 | $285,600 |
| 2020 | $1,816 | $344,200 | $86,100 | $258,100 |
| 2019 | $1,585 | $312,300 | $86,100 | $226,200 |
| 2018 | $1,658 | $312,300 | $86,100 | $226,200 |
| 2017 | $1,647 | $166,100 | $0 | $0 |
| 2016 | $1,489 | $138,490 | $0 | $0 |
| 2015 | $1,507 | $132,550 | $0 | $0 |
| 2014 | $1,357 | $118,800 | $0 | $0 |
Source: Public Records
Map
Nearby Homes