
Seller's Agent in 2025
HEATHER GAUS
Cowan, Realtors
(419) 236-4391
133 Total Sales
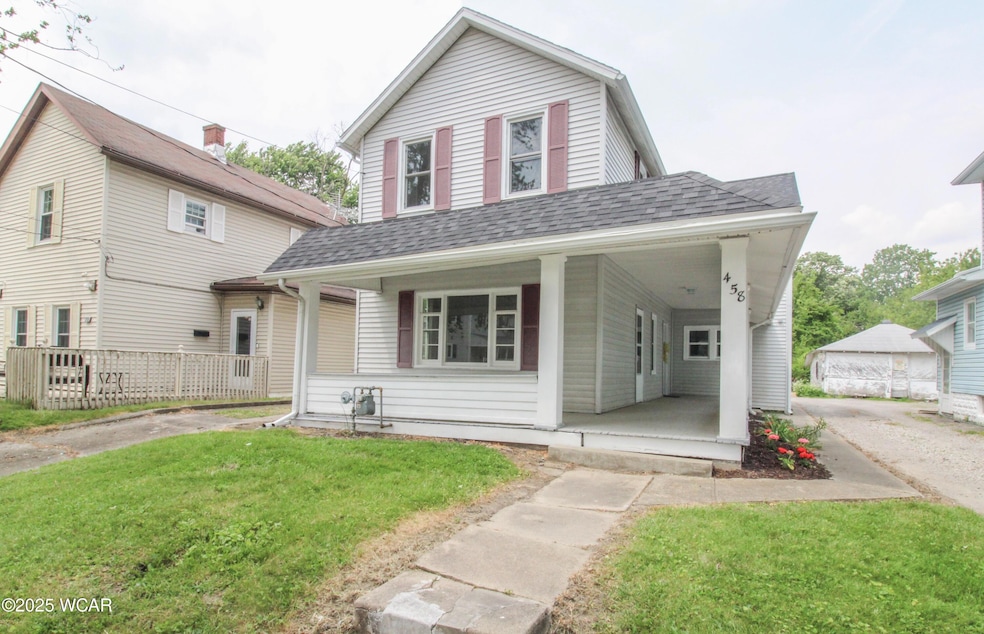
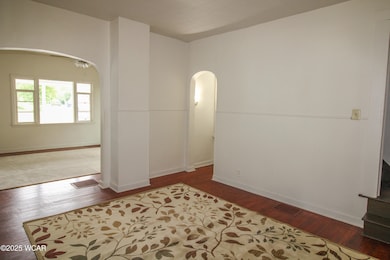
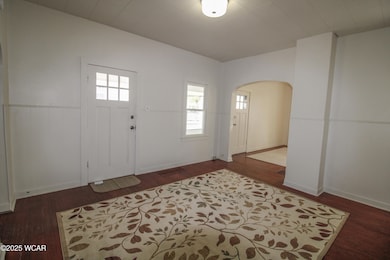
Step inside to find a blend of classic charm and modern updates, with the beautiful original hardwood floors and fresh paint.
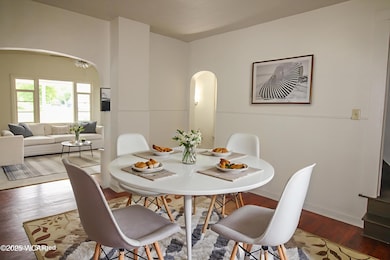
The main floor features large living areas, perfect for relaxing or entertaining, with arched doorways adding timeless character. The kitchen is generously sized with ample cabinetry, updated countertops, and new flooring, Main floor laundry and bathroom.
Upstairs, you'll find three spacious bedrooms with plenty of natural light, along with a second full bathroom. Each room provides flexibility for family, guests, or a home office.
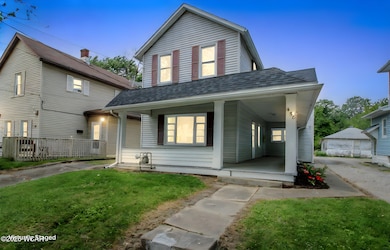
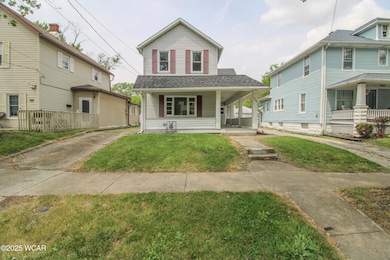
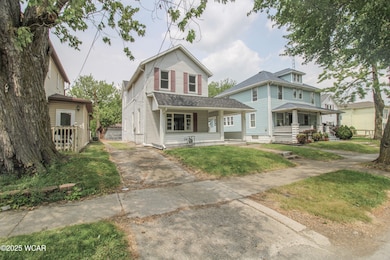
Enjoy the covered front porch, detached garage, large backyard, and two driveways—one private and one shared—offering plenty of parking for guests or multiple vehicles. This home offers the perfect blend of space, style, and functionality.
Photos have been virtually staged
Last Agent to Sell the Property
Cowan, Realtors License #2019007502 Listed on: 06/05/2025
| Date | Type | Sale Price | Title Company |
|---|---|---|---|
| Warranty Deed | $150,000 | None Listed On Document | |
| Limited Warranty Deed | $16,600 | Attorney | |
| Sheriffs Deed | $30,000 | None Available | |
| Warranty Deed | $80,000 | None Available | |
| Special Warranty Deed | $27,500 | None Available | |
| Sheriffs Deed | $32,000 | None Available | |
| Deed | $18,000 | -- |
| Date | Status | Loan Amount | Loan Type |
|---|---|---|---|
| Open | $4,500 | New Conventional | |
| Previous Owner | $68,000 | Adjustable Rate Mortgage/ARM |
| Date | Event | Price | List to Sale | Price per Sq Ft |
|---|---|---|---|---|
| 08/07/2025 08/07/25 | Sold | $150,000 | -16.2% | $83 / Sq Ft |
| 07/14/2025 07/14/25 | Pending | -- | -- | -- |
| 06/05/2025 06/05/25 | For Sale | $179,000 | -- | $99 / Sq Ft |
| Year | Tax Paid | Tax Assessment Tax Assessment Total Assessment is a certain percentage of the fair market value that is determined by local assessors to be the total taxable value of land and additions on the property. | Land | Improvement |
|---|---|---|---|---|
| 2024 | $964 | $25,630 | $3,260 | $22,370 |
| 2023 | $874 | $20,170 | $2,560 | $17,610 |
| 2022 | $878 | $20,170 | $2,560 | $17,610 |
| 2021 | $981 | $20,170 | $2,560 | $17,610 |
| 2020 | $953 | $18,340 | $2,450 | $15,890 |
| 2019 | $953 | $18,340 | $2,450 | $15,890 |
| 2018 | $943 | $18,340 | $2,450 | $15,890 |
| 2017 | $956 | $18,340 | $2,450 | $15,890 |
| 2016 | $969 | $18,340 | $2,450 | $15,890 |
| 2015 | $1,004 | $18,340 | $2,450 | $15,890 |
| 2014 | $1,004 | $18,730 | $2,420 | $16,310 |
| 2013 | $978 | $18,730 | $2,420 | $16,310 |
Seller's Agent in 2025
HEATHER GAUS
Cowan, Realtors
(419) 236-4391
133 Total Sales
Seller Co-Listing Agent in 2025
Robin Flanagan
Cowan, Realtors
(419) 234-6111
90 Total Sales
S
Buyer's Agent in 2025
SHEILA CUSTER
Howard Hanna--Lima
(419) 296-6408
28 Total Sales
Source: West Central Association of REALTORS® (OH)
MLS Number: 307281
APN: 36-25-12-06-027.000