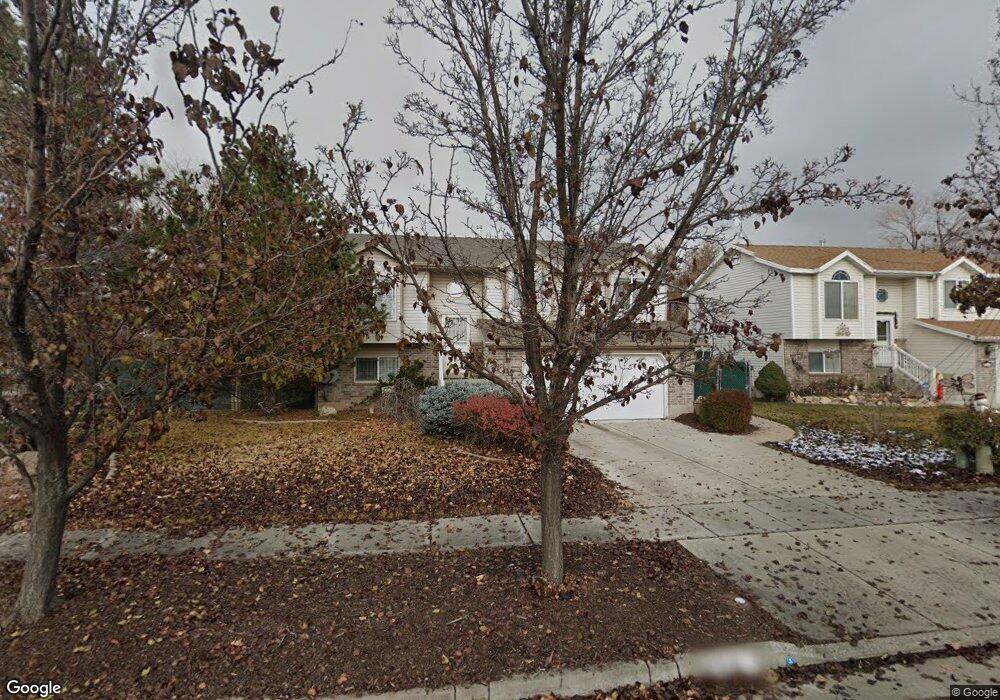
458 W Woodbury Dr Ogden, UT 84404
Lynn NeighborhoodEstimated Value: $417,000 - $435,641
4
Beds
3
Baths
1,826
Sq Ft
$233/Sq Ft
Est. Value
About This Home
This home is located at 458 W Woodbury Dr, Ogden, UT 84404 and is currently estimated at $425,160, approximately $232 per square foot. 458 W Woodbury Dr is a home located in Weber County with nearby schools including Heritage Elementary School, Highland Junior High School, and Ben Lomond High School.
Ownership History
Date
Name
Owned For
Owner Type
Purchase Details
Closed on
Dec 8, 2010
Sold by
Newhart Polly
Bought by
Newhart Bryson
Current Estimated Value
Purchase Details
Closed on
Nov 18, 2009
Sold by
Mullner Gail Elizabeth
Bought by
Newhart Bryson and Newhart Polly
Home Financials for this Owner
Home Financials are based on the most recent Mortgage that was taken out on this home.
Original Mortgage
$114,800
Interest Rate
4.29%
Mortgage Type
New Conventional
Purchase Details
Closed on
Oct 21, 2004
Sold by
Mike Schultz Construction Inc
Bought by
Muliner Gail Elizabeth
Home Financials for this Owner
Home Financials are based on the most recent Mortgage that was taken out on this home.
Original Mortgage
$103,895
Interest Rate
5.74%
Mortgage Type
Purchase Money Mortgage
Create a Home Valuation Report for This Property
The Home Valuation Report is an in-depth analysis detailing your home's value as well as a comparison with similar homes in the area
Home Values in the Area
Average Home Value in this Area
Purchase History
| Date | Buyer | Sale Price | Title Company |
|---|---|---|---|
| Newhart Bryson | -- | None Available | |
| Newhart Bryson | -- | First American Fashion Point | |
| Muliner Gail Elizabeth | -- | Heritage West Title Ins |
Source: Public Records
Mortgage History
| Date | Status | Borrower | Loan Amount |
|---|---|---|---|
| Closed | Newhart Bryson | $114,800 | |
| Previous Owner | Muliner Gail Elizabeth | $103,895 |
Source: Public Records
Tax History
| Year | Tax Paid | Tax Assessment Tax Assessment Total Assessment is a certain percentage of the fair market value that is determined by local assessors to be the total taxable value of land and additions on the property. | Land | Improvement |
|---|---|---|---|---|
| 2025 | $2,926 | $429,028 | $131,784 | $297,244 |
| 2024 | $2,973 | $235,399 | $72,484 | $162,915 |
| 2023 | $2,899 | $231,000 | $69,202 | $161,798 |
| 2022 | $2,740 | $218,900 | $52,814 | $166,086 |
| 2021 | $2,345 | $311,000 | $70,994 | $240,006 |
| 2020 | $2,269 | $278,000 | $55,839 | $222,161 |
| 2019 | $2,261 | $260,000 | $45,769 | $214,231 |
| 2018 | $1,986 | $227,000 | $45,769 | $181,231 |
| 2017 | $1,842 | $200,999 | $40,688 | $160,311 |
| 2016 | $1,676 | $96,695 | $21,698 | $74,997 |
| 2015 | $1,554 | $87,520 | $21,698 | $65,822 |
| 2014 | $1,583 | $87,521 | $19,005 | $68,516 |
Source: Public Records
Map
Nearby Homes
- 617 S 375 W
- 5332 S Century Way W Unit 111
- 900 S Century Dr Unit 59
- 900 S Century Dr Unit 72
- 101 S Century Dr Unit 101
- 820 S Wildflower Cir
- 197 W 2nd St
- 900 Century Dr Unit 130
- 900 Century Dr Unit 69
- 900 Century Dr Unit 60
- 900 Century Dr Unit 66
- 315 W Leann Way
- 152 W 2nd St
- 889 S Clover Cir
- 157 N Keogh Ln
- 447 950 S
- 445 950 S
- 451 W 980 S
- 447 W 980 S
- 130 7th #C304 St
- 458 W Woodbury Dr Unit Lot 12
- 450 W Woodbury Dr
- 450 W Woodbury Dr Unit 13
- 444 W Woodbury Dr
- 457 W Woodbury Dr
- 457 W Woodbury Dr Unit 30
- 443 S Century Dr
- 433 S Century Dr
- 433 S Century Dr Unit 11
- 455 S Century Dr
- 455 S Century Dr Unit Lot 9
- 436 W Woodbury Dr
- 447 W Woodbury Dr
- 447 W Woodbury Dr Unit 29
- 439 W Woodbury Dr
- 439 W Woodbury Dr Unit Lot 28
- 467 S Century Dr
- 430 W Woodbury Dr
- 430 W Woodbury Dr Unit 16
- 510 S 430 W
Your Personal Tour Guide
Ask me questions while you tour the home.