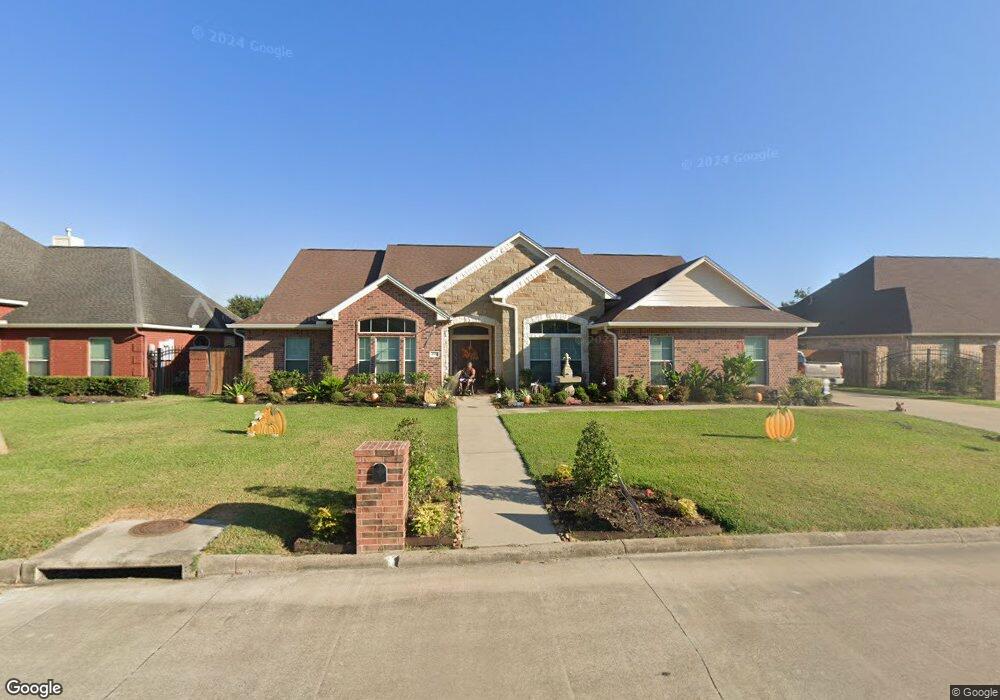
4580 Roberts Ave Unit 6 Beaumont, TX 77707
South 23rd Street NeighborhoodEstimated Value: $265,000 - $305,000
4
Beds
3
Baths
2,207
Sq Ft
$131/Sq Ft
Est. Value
About This Home
This home is located at 4580 Roberts Ave Unit 6, Beaumont, TX 77707 and is currently estimated at $289,214, approximately $131 per square foot. 4580 Roberts Ave Unit 6 is a home located in Jefferson County with nearby schools including Caldwood Elementary School, Odom Middle School, and West Brook Sr High School.
Ownership History
Date
Name
Owned For
Owner Type
Purchase Details
Closed on
Nov 16, 2020
Sold by
Rita Roberts Llc
Bought by
Coleman Corey and Ward Quantos Chantelle
Current Estimated Value
Home Financials for this Owner
Home Financials are based on the most recent Mortgage that was taken out on this home.
Original Mortgage
$261,250
Outstanding Balance
$232,475
Interest Rate
2.8%
Mortgage Type
New Conventional
Estimated Equity
$56,739
Purchase Details
Closed on
Jan 7, 2020
Sold by
County Of Jefferson
Bought by
Palmlink Realty Llc
Purchase Details
Closed on
Oct 1, 2019
Sold by
Thomas Perry C and Mcgowan Don L
Bought by
Romar Gerald and Romar Cassandra
Purchase Details
Closed on
Nov 1, 2016
Sold by
Smith Tracy Paul and Smith Jennifer Blackman
Bought by
Lancelot Homes Llc
Create a Home Valuation Report for This Property
The Home Valuation Report is an in-depth analysis detailing your home's value as well as a comparison with similar homes in the area
Home Values in the Area
Average Home Value in this Area
Purchase History
| Date | Buyer | Sale Price | Title Company |
|---|---|---|---|
| Coleman Corey | $347,462 | American Title Company | |
| Palmlink Realty Llc | $131,315 | None Available | |
| Romar Gerald | $20,000 | None Available | |
| Lancelot Homes Llc | -- | Attorney |
Source: Public Records
Mortgage History
| Date | Status | Borrower | Loan Amount |
|---|---|---|---|
| Open | Coleman Corey | $261,250 |
Source: Public Records
Tax History Compared to Growth
Tax History
| Year | Tax Paid | Tax Assessment Tax Assessment Total Assessment is a certain percentage of the fair market value that is determined by local assessors to be the total taxable value of land and additions on the property. | Land | Improvement |
|---|---|---|---|---|
| 2025 | $4,090 | $279,813 | -- | -- |
| 2024 | $4,090 | $254,375 | $14,000 | $240,375 |
| 2023 | $4,090 | $268,515 | $14,000 | $254,515 |
| 2022 | $6,648 | $254,375 | $14,000 | $240,375 |
| 2021 | $6,906 | $254,375 | $14,000 | $240,375 |
| 2020 | $5,743 | $210,643 | $14,000 | $196,643 |
| 2019 | $903 | $210,650 | $14,000 | $196,650 |
| 2018 | $6,180 | $221,000 | $14,000 | $207,000 |
| 2017 | $5,219 | $189,950 | $14,000 | $175,950 |
| 2016 | $5,223 | $189,950 | $14,000 | $175,950 |
| 2015 | $3,225 | $179,600 | $14,000 | $165,600 |
| 2014 | $3,225 | $117,490 | $14,000 | $103,490 |
Source: Public Records
Map
Nearby Homes
- 4565 Roberts Ave
- 4425 Cartwright St
- 4730 Cartwright St
- 11357 Interstate 10
- 1600 Washington Village Pkwy
- 1580 Washington Village Pkwy
- 1560 Washington Village Pkwy
- 1620 Washington Village Pkwy
- 3250 Yasmine Dior St
- 3110 Ethan Symone St
- 3090 Ethan Symone St
- 3255 Ethan Symone St
- 4097 Interstate 10
- 3210 Yasmine Dior St
- 4255 Gaurseni St
- 4235 Gaurseni St
- 4195 College St
- 3280 Blossom Dr
- 3987 College St
- 4160 Simpson Dr
- 4580 Roberts Ave
- 4570 Roberts Ave
- 4695 Roberts Ave
- 0 Roberts Ave Unit Tyrrell Park
- 4575 Cartwright St
- 4545 Cartwright St
- 4595 Cartwright St
- 4560 Roberts Ave
- 4525 Cartwright St
- 4610 Roberts Ave
- 4625 Cartwright St
- 4465 Cartwright St
- 4540 Cartwright St
- 4555 Roberts Ave
- 4580 Cartwright St
- 4520 Cartwright St
- 4635 Cartwright St
- 4625 Roberts Ave
- 4455 Cartwright St
- 4480 Cartwright St