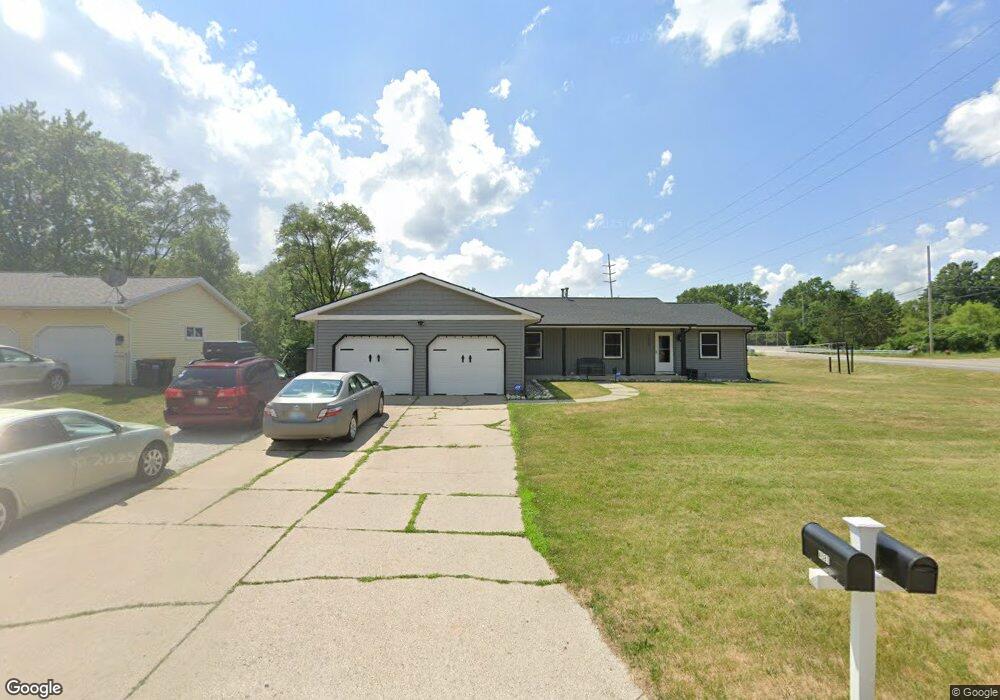
4581 Sarafield St NE Grand Rapids, MI 49525
Northview NeighborhoodEstimated Value: $326,946 - $428,000
2
Beds
--
Bath
1,700
Sq Ft
$224/Sq Ft
Est. Value
About This Home
This home is located at 4581 Sarafield St NE, Grand Rapids, MI 49525 and is currently estimated at $381,237, approximately $224 per square foot. 4581 Sarafield St NE is a home located in Kent County with nearby schools including West Oakview Elementary School, North Oakview Elementary School, and East Oakview Elementary School.
Ownership History
Date
Name
Owned For
Owner Type
Purchase Details
Closed on
Feb 5, 2020
Sold by
Deshane Jill and Deshane Jill Kelly
Bought by
Deshane Jill K and Ramirez Cesar A
Current Estimated Value
Home Financials for this Owner
Home Financials are based on the most recent Mortgage that was taken out on this home.
Original Mortgage
$183,658
Outstanding Balance
$162,986
Interest Rate
3.72%
Mortgage Type
FHA
Estimated Equity
$218,251
Purchase Details
Closed on
Feb 4, 2020
Sold by
Deshane Louis and Deshane James
Bought by
Deshane Jill and Deshane Jill Kelly
Home Financials for this Owner
Home Financials are based on the most recent Mortgage that was taken out on this home.
Original Mortgage
$183,658
Outstanding Balance
$162,986
Interest Rate
3.72%
Mortgage Type
FHA
Estimated Equity
$218,251
Purchase Details
Closed on
Mar 23, 2005
Sold by
Kroon 1031 Llc
Bought by
Deshane Louis and Deshane Jill
Home Financials for this Owner
Home Financials are based on the most recent Mortgage that was taken out on this home.
Original Mortgage
$161,200
Interest Rate
6%
Mortgage Type
Purchase Money Mortgage
Purchase Details
Closed on
Nov 21, 2003
Sold by
Stotler Deborah and Borzi Deborah
Bought by
Kroon 1031 Llc
Create a Home Valuation Report for This Property
The Home Valuation Report is an in-depth analysis detailing your home's value as well as a comparison with similar homes in the area
Home Values in the Area
Average Home Value in this Area
Purchase History
| Date | Buyer | Sale Price | Title Company |
|---|---|---|---|
| Deshane Jill K | -- | None Available | |
| Deshane Jill | -- | None Available | |
| Deshane Louis | $201,500 | -- | |
| Kroon 1031 Llc | $175,000 | Metropolitan Title Co |
Source: Public Records
Mortgage History
| Date | Status | Borrower | Loan Amount |
|---|---|---|---|
| Open | Deshane Jill K | $183,658 | |
| Previous Owner | Deshane Louis | $161,200 | |
| Closed | Deshane Louis | $40,300 |
Source: Public Records
Tax History Compared to Growth
Tax History
| Year | Tax Paid | Tax Assessment Tax Assessment Total Assessment is a certain percentage of the fair market value that is determined by local assessors to be the total taxable value of land and additions on the property. | Land | Improvement |
|---|---|---|---|---|
| 2025 | $2,513 | $154,700 | $0 | $0 |
| 2024 | $2,513 | $147,600 | $0 | $0 |
| 2023 | $2,402 | $128,400 | $0 | $0 |
| 2022 | $3,699 | $117,300 | $0 | $0 |
| 2021 | $3,597 | $110,300 | $0 | $0 |
| 2020 | $2,208 | $107,800 | $0 | $0 |
| 2019 | $3,508 | $107,200 | $0 | $0 |
| 2018 | $3,432 | $104,400 | $0 | $0 |
| 2017 | $3,332 | $81,200 | $0 | $0 |
| 2016 | $3,236 | $80,800 | $0 | $0 |
| 2015 | $3,219 | $80,800 | $0 | $0 |
| 2013 | -- | $76,700 | $0 | $0 |
Source: Public Records
Map
Nearby Homes
- 2285-2289 Airway St NE
- 2289 Airway St NE
- 2285 Airway St NE
- 2233 Airway St NE
- 4611 Plainfield Ave NE
- 4750 Hunsberger Ave NE
- 4372 Hunsberger Ave NE
- 4847 Ridgeline Dr NE
- 4683 Rockvalley Dr NE Unit 2
- 1940 Eldon St NE
- 4785 Rockvalley Dr NE
- 5073 Coit Ave NE
- 5605 Coit Ave NE
- 5741 Coit Ave NE
- 4148 Chadwick Ave NE
- 4495 Trail View NE
- 4740 Paramount Dr NE
- 3886 Vineyard Ave NE
- 5011 Coit Ave NE
- 3895 Keeweenaw Dr NE
- 4581 Sarafield St NE
- 4581 Sarafield St NE Unit 4583
- 4571 Sarafield St NE
- 2233-1 Airway St NE
- 2233-2 Airway St NE
- 2233-3 Airway St NE
- 0 Airway St NE
- 0 Airway St NE
- 2271 Airway St NE
- 2310 Airway St NE
- 4551 Sarafield St NE
- 4551 Sarafield St NE Unit 4553
- 4562 Sarafield St NE
- 4535 Sarafield St NE
- 4546 Sarafield St NE
- 4544 Sarafield St NE
- 2334 Airway St NE
- 2307 Airway St NE
- 2240 Airway St NE
- 2245 Airway St NE